Volume 4: Pipeline Orchestration
Estimated time: 35–50 minutes Goal: Understand the internal structure of scenario tasks, learn to modify existing pipelines, and build new scenario tasks from scratch using built-in capabilities Prerequisites: Completed Volume 2: Scenario Configuration and Volume 3: VLM / DINO Guide; familiar with video sources, service assignment, live preview, and alarm records No extra environment needed: This tutorial only uses built-in capabilities — no Docker or model conversion involved
In the first three volumes, you learned two things:
- How to configure common detection scenarios using built-in CV algorithms.
- How to define new detection rules using VLM / DINO.
But up to this point, you've mainly been "using pre-built capabilities."
This tutorial takes you one level deeper: understanding how those capabilities are organized, and learning to orchestrate them yourself.
Three progressive chapters:
- Chapter 1: Read and understand existing scenario task internals
- Chapter 2: Modify an existing scenario task
- Chapter 3: Build a new scenario task from scratch
Note
This tutorial covers "how to organize capabilities." The next tutorial, Volume 5: Model Porting, covers "how to bring in new third-party model capabilities."
Learning Path
Read and understand existing scenario tasks
  ↓
Make small modifications to existing tasks
  ↓
Build new scenario tasks by referencing existing structure
After completing this tutorial, you'll be able to:
- Understand what a scenario task does internally
- Judge where a given node belongs in the pipeline
- Independently add, remove, and reconfigure nodes
- Build new business logic using built-in capabilities
Chapter 1: Understanding Scenario Task Pipelines
In the Scenario Configuration Guide, you primarily worked on the "Service Assignment" page — selecting algorithms, drawing regions, and tuning parameters. Behind the scenes, each of these operations maps to a scenario task pipeline.
Each scenario task is essentially a processing chain:
Input → Inference → Logic → OutputThis chapter is read-only — no modifications.
1.1 Open the "No Hard Hat" Scenario Task
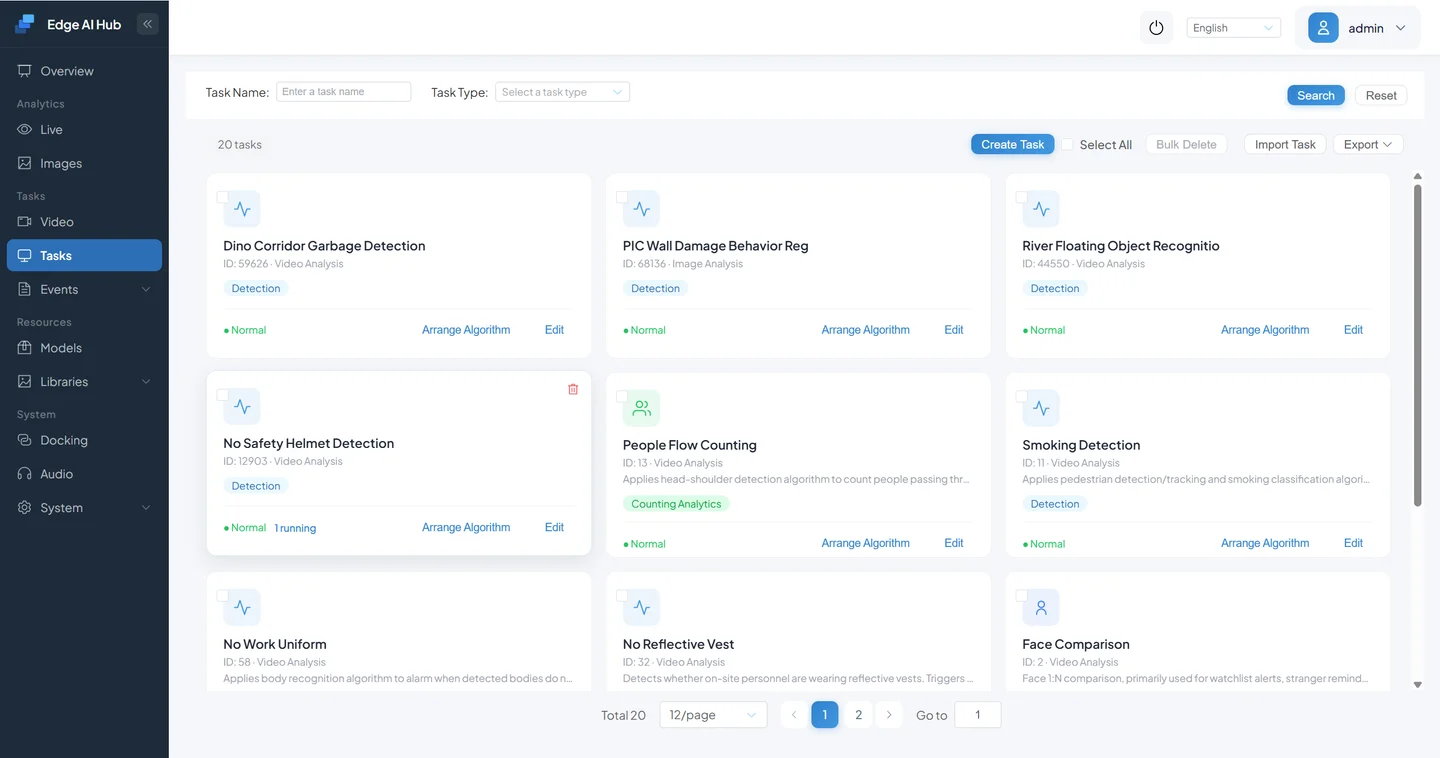
- Navigate to Scenario Tasks.
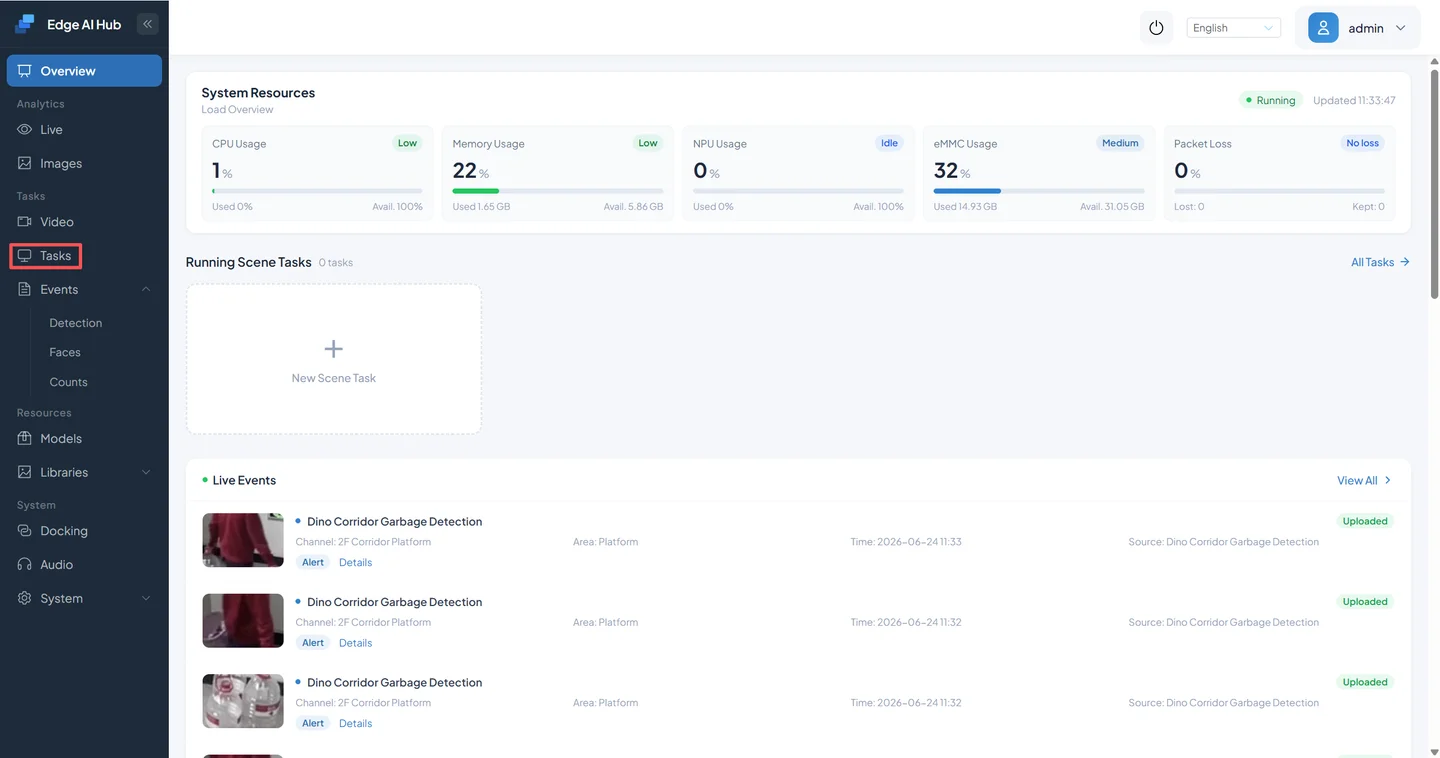
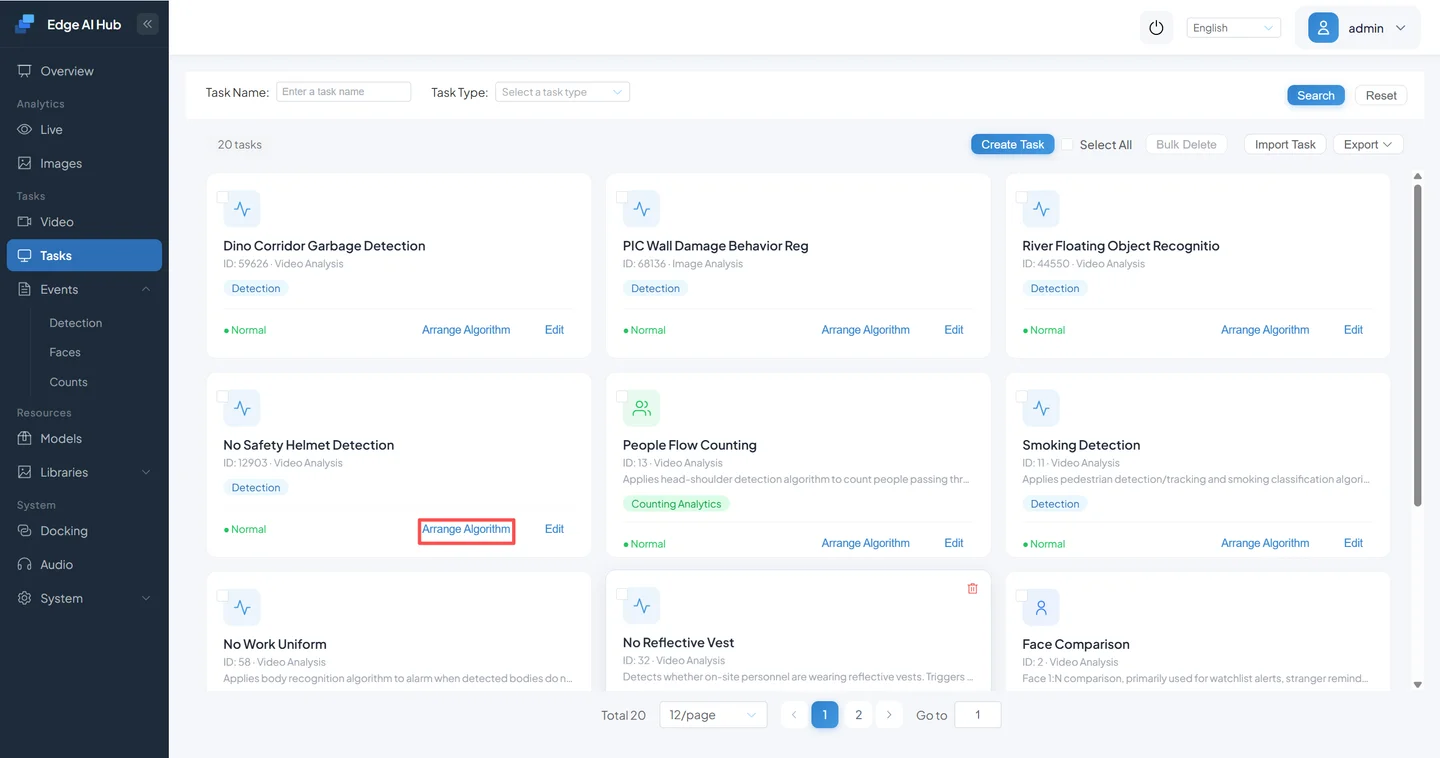
- Find No Hard Hat.
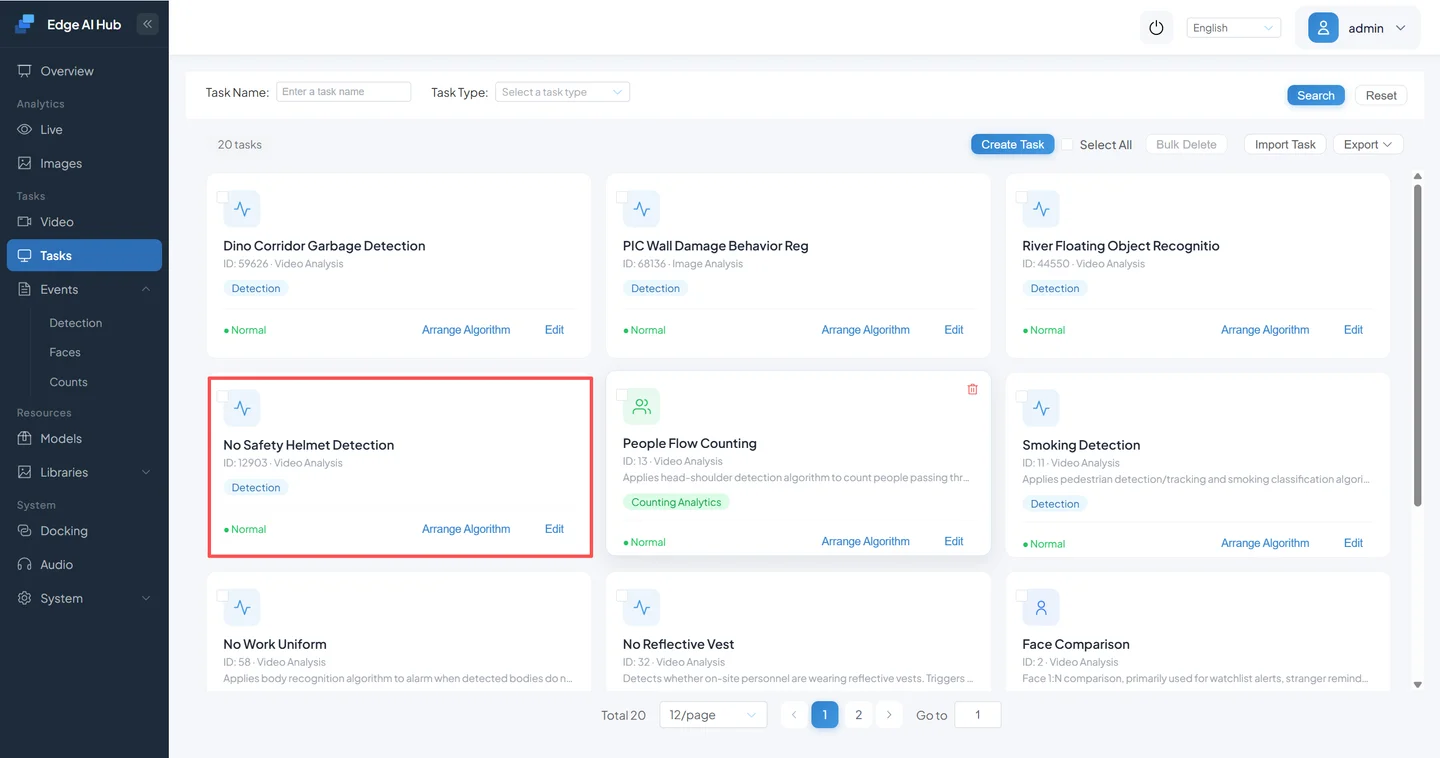
- Click Pipeline Orchestration.
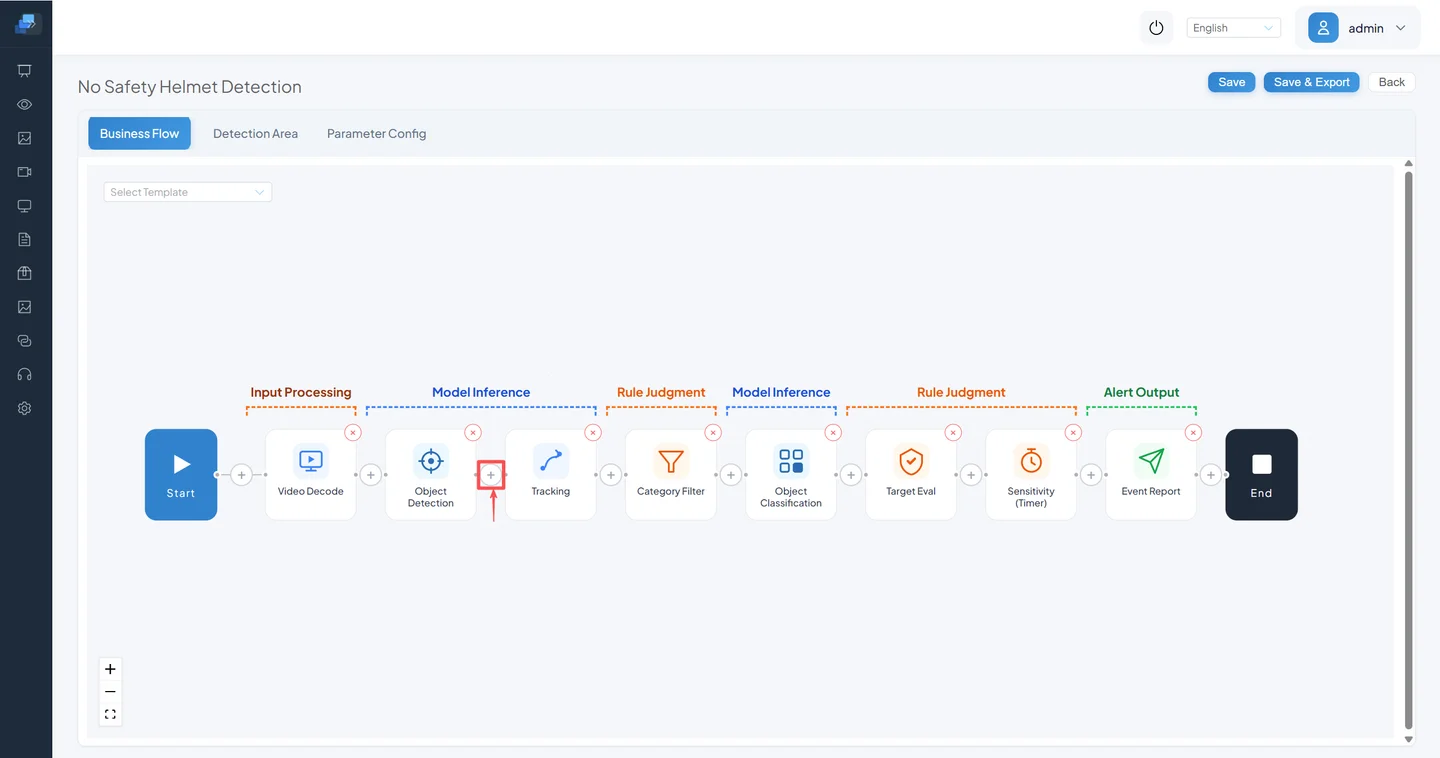
You'll see a complete node chain — this is the internal structure of the "No Hard Hat" scenario.

1.2 Common Node Types
Input Nodes
| Node | Purpose | Notes |
|---|---|---|
| Video Decode | Decodes a video stream into individual frames | Starting point for nearly every scenario task |
Inference Nodes
| Node | Purpose | Notes |
|---|---|---|
| Object Detection | Locates targets in the frame | e.g., pedestrian detection, hard hat detection |
| Object Classification | Re-classifies detected targets | e.g., determining hard hat status |
| Tracking | Assigns stable IDs to targets | Maintains identity across frames |
| Vision Language Model | Performs state judgment on images | e.g., "Is the door open or closed?" |
| Detection Vision Model | Detects targets from text prompts | e.g., "garbage bin," "fire cabinet" |
Logic Nodes
| Node | Purpose | Notes |
|---|---|---|
| Category Filter | Keeps only specified classes | Drops irrelevant detection results |
| Size Filter | Filters targets that are too small or large | Eliminates noise from distant small objects |
| Region Judgment | Checks if a target is inside a defined region | Corresponds to the detection regions drawn in Volume 2 |
| Line Crossing | Checks if a target crosses a defined line | Used for pedestrian flow counting |
| Sensitivity Calculation | Requires multiple consecutive hits before triggering | Reduces single-frame false positives |
Output Nodes
| Node | Purpose | Notes |
|---|---|---|
| Event Reporting | Generates alarm events | Visible in the alarm records |
Tip
You don't need to memorize every node. A more efficient approach: find the closest built-in scenario task and modify it.
1.3 How Data Flows Between Nodes
Looking at the "No Hard Hat" pipeline, data flows roughly like this:
Video Decode
  ↓ Output: individual frames
Object Detection (pedestrian detection)
  ↓ Output: bounding boxes + classes + confidence
Object Tracking
  ↓ Output: bounding boxes + classes + confidence + track sequence
Category Filter
  ↓ Output: only the target class retained
Object Classification (hard hat classification)
  ↓ Output: hard hat status for each person
Sensitivity Calculation
  ↓ Output: triggers alarm only after consecutive hits
Event Reporting
  ↓ Output: structured alarm event
Video Visualization Overlay
  ↓ Output: bounding boxes, labels, and alerts on the live feed
Once you understand this flow, most scenario tasks become readable:
- Each node consumes the output of the previous node.
- Each node does exactly one thing.
- Node order directly affects the final result.
1.4 Principles for Node Ordering
When orchestrating pipelines, follow these guidelines:
- Filter invalid results as early as possible. For example, targets that are too small should be filtered before they reach classification or complex logic nodes.
- Generate targets first, then apply rules. Region judgment, line crossing, and sensitivity all require upstream detection results.
- If you want results visible in the live preview, you typically need a visualization overlay node. Event reporting alone will generate alarm records, but won't show bounding boxes on screen.
Chapter 2: Modifying an Existing Scenario Task
Let's make a practical improvement to the "No Hard Hat" pipeline we examined earlier.
Scenario Description
In the hard hat detection scenario from Volume 2, distant and very small pedestrians sometimes get detected. But these targets have too few pixels for reliable classification, leading to false positives. The fix: add a Size Filter node to the pipeline, so the system automatically ignores targets that are too small.
2.1 Add a Category Filter Node
Continuing from Section 1.1, add a size filter between Object Detection and Object Tracking.
- Click the add button between Object Detection and Object Tracking.
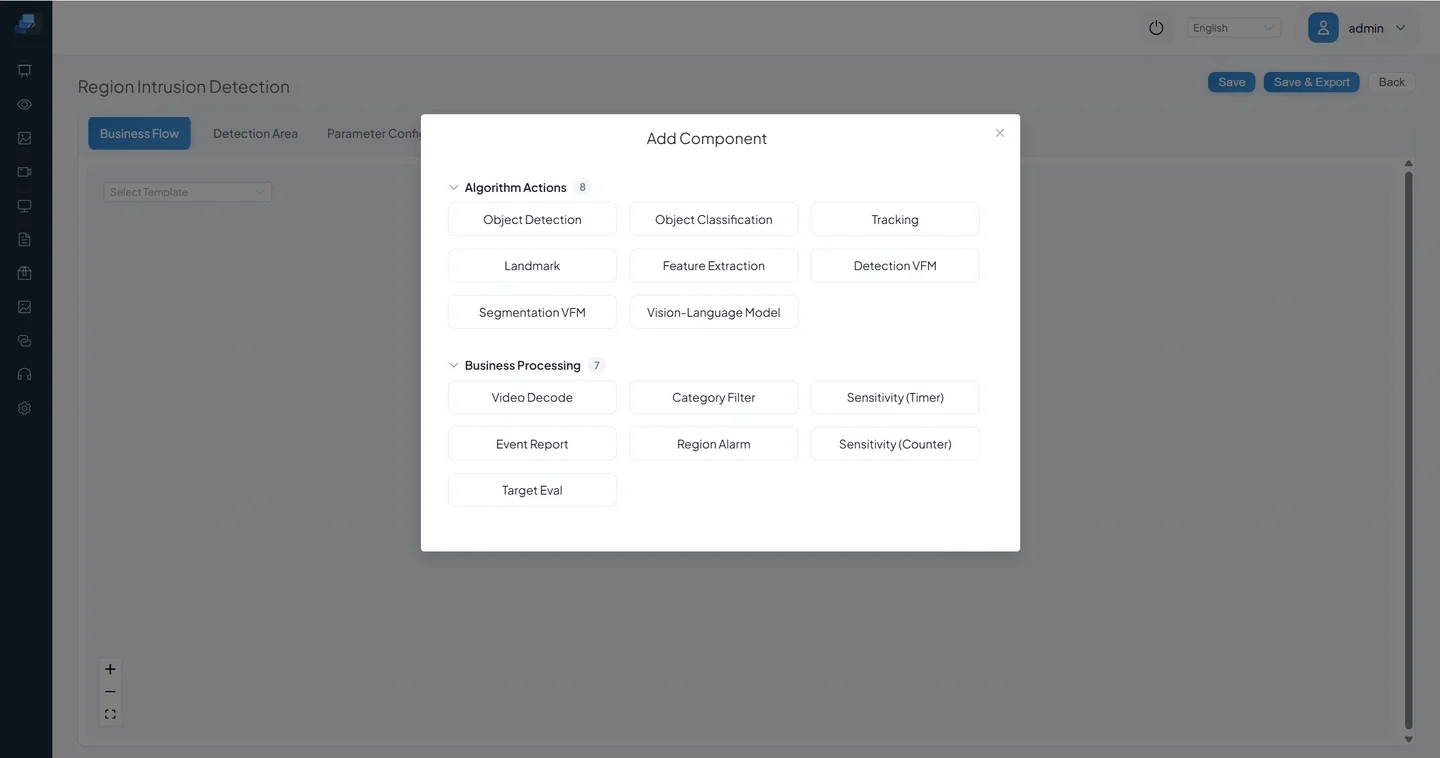
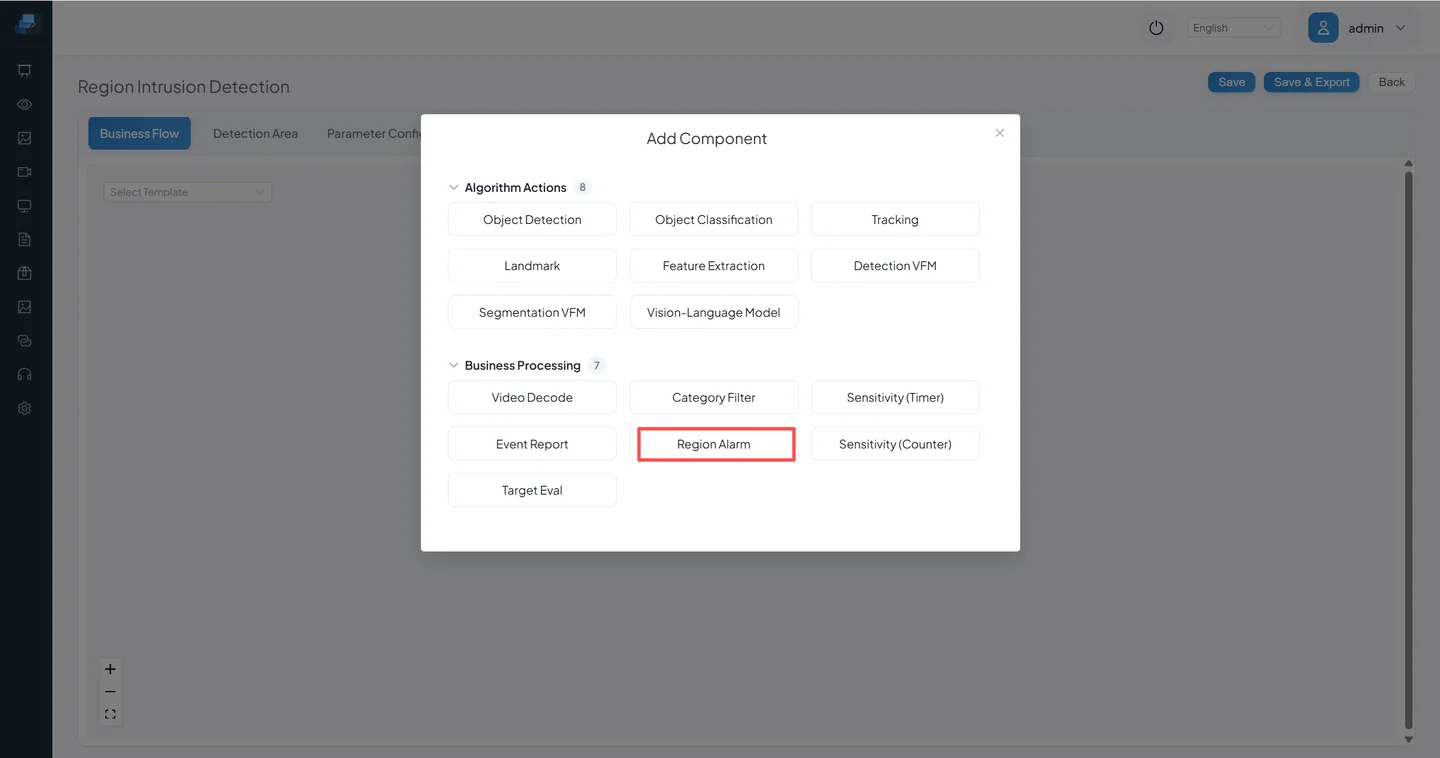
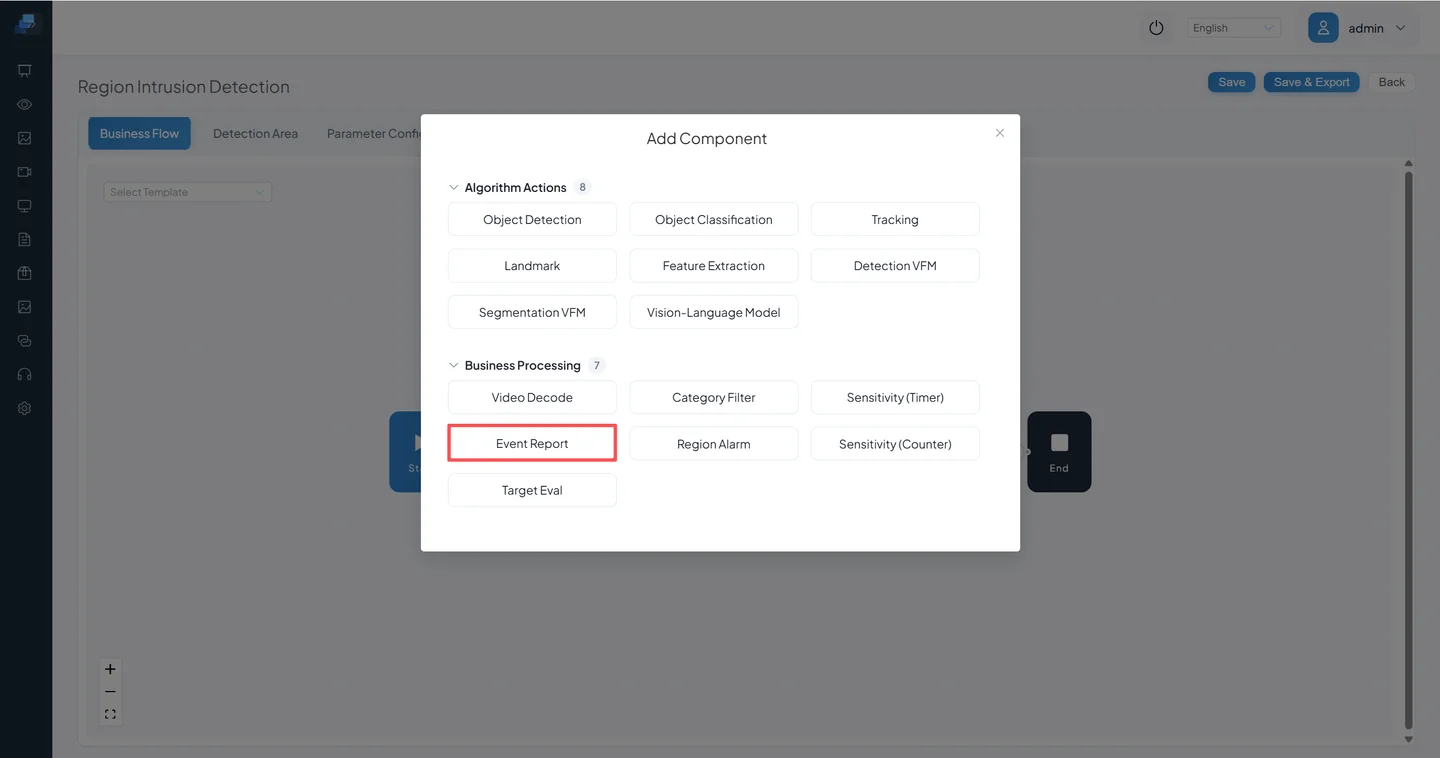
- Click Add Component.
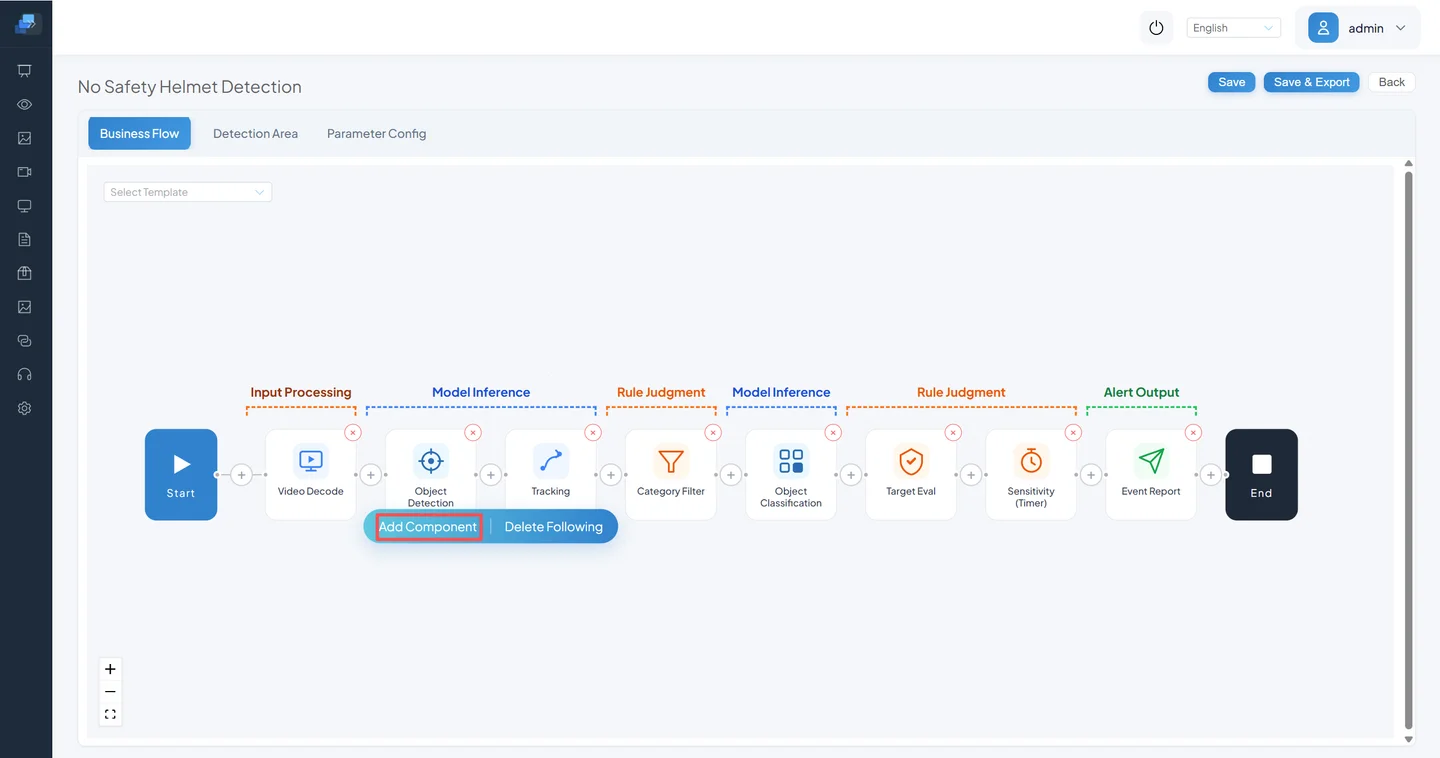

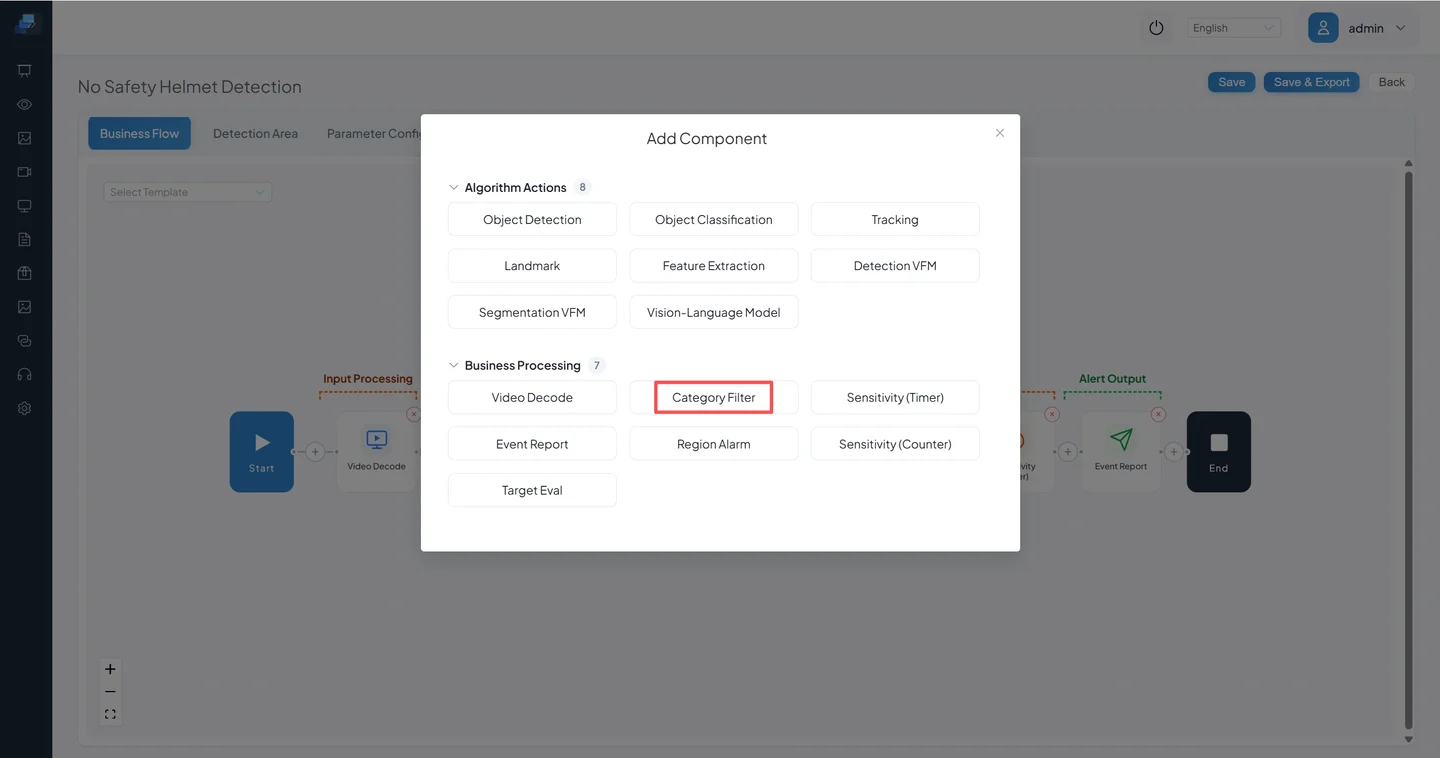
Components are organized into two categories:
- Algorithm Actions: Model-related components (object detection, feature extraction, etc.)
- Business Processing: Workflow components (video decode, event reporting, etc.)
- Select the Category Filter component.
The Category Filter node is inserted at the expected position.
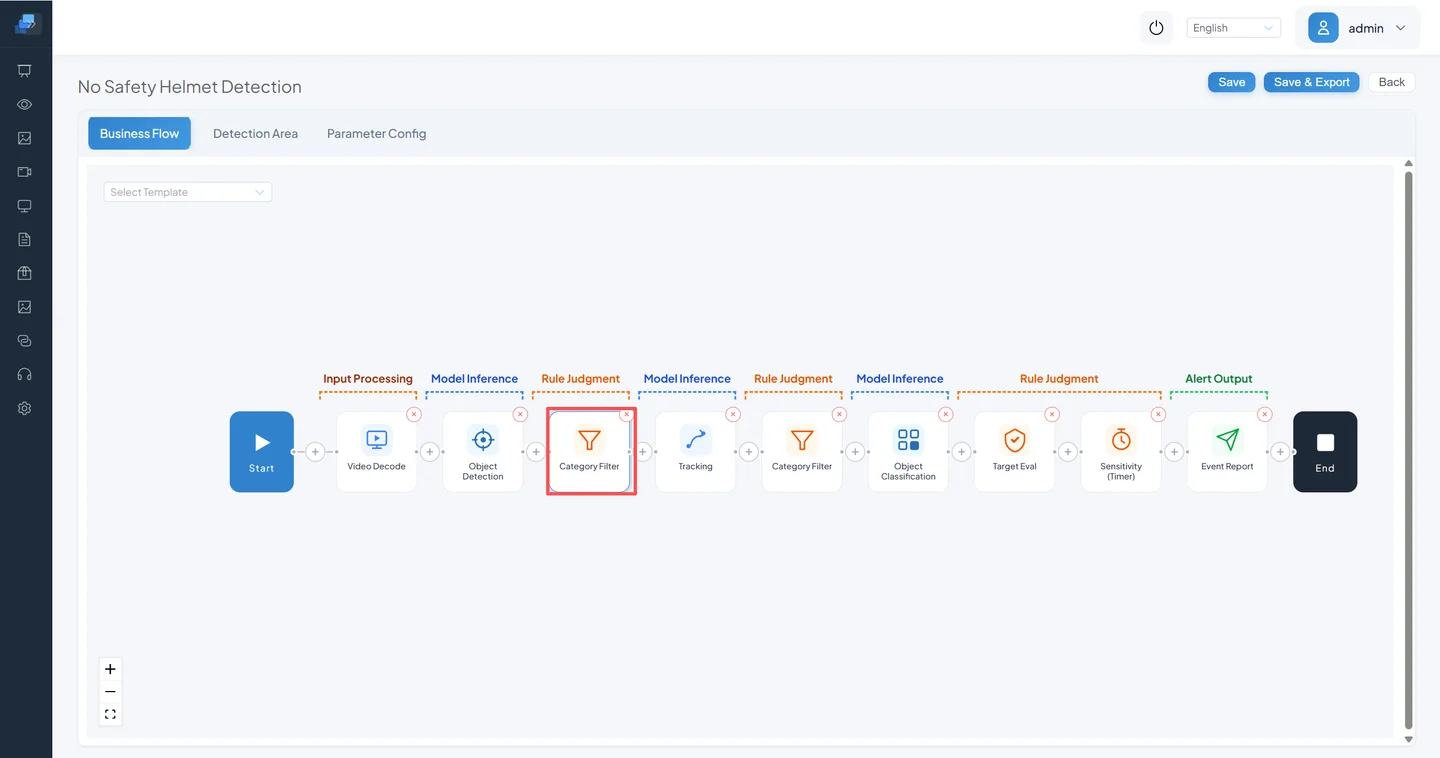
Why here?
The goal of size filtering is to eliminate invalid targets as early as possible. Waiting until after tracking, classification, or downstream rule processing wastes compute and increases false positives.
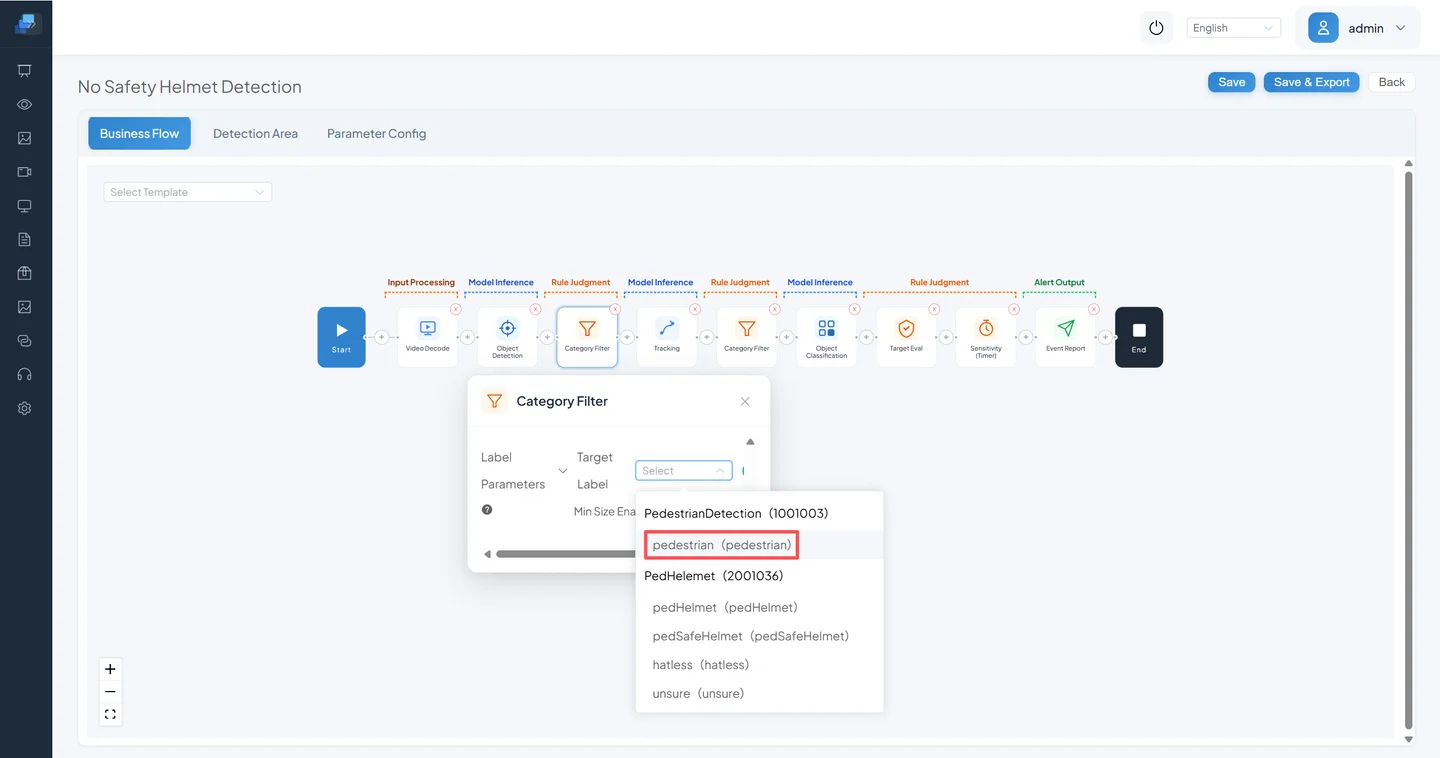
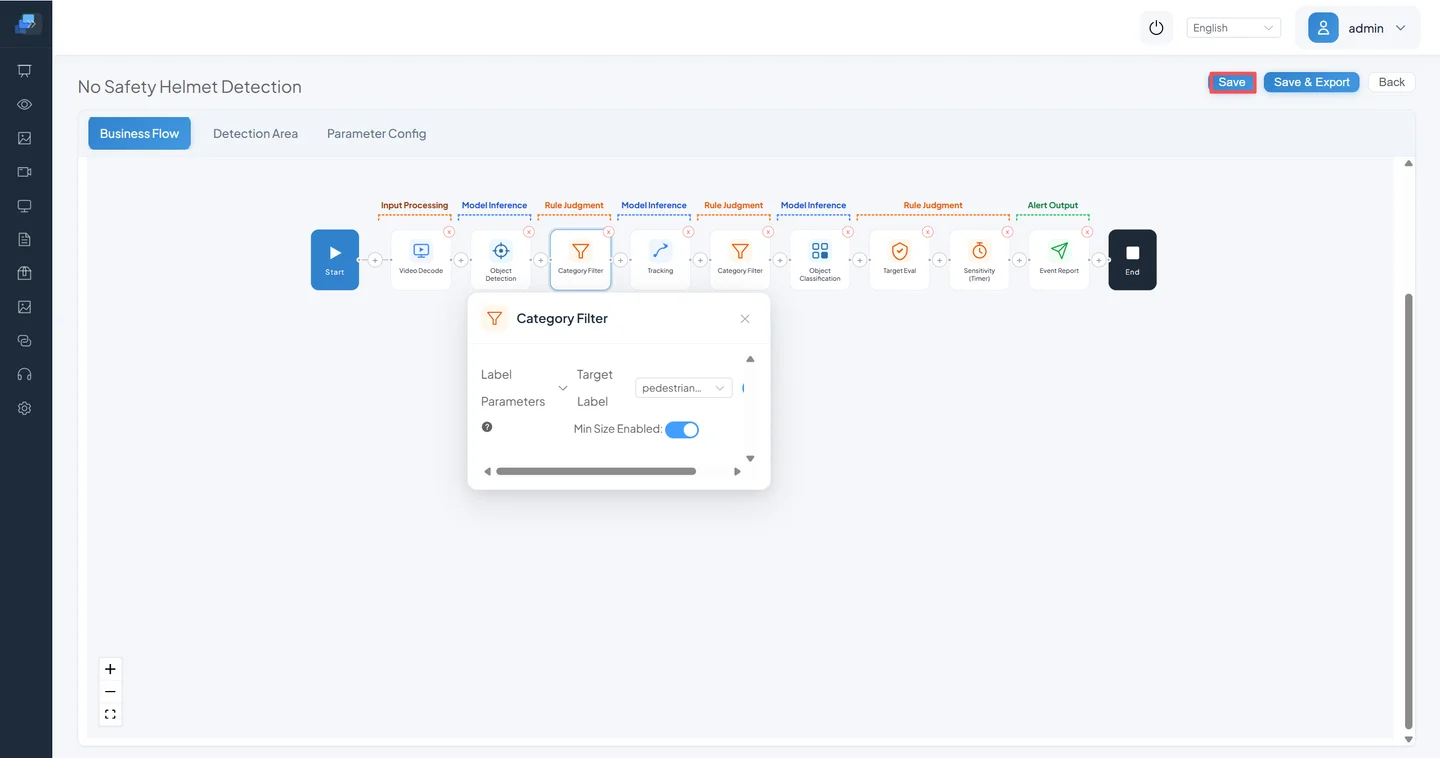
Configure the business logic
Click the Category Filter component to expand its configuration panel.
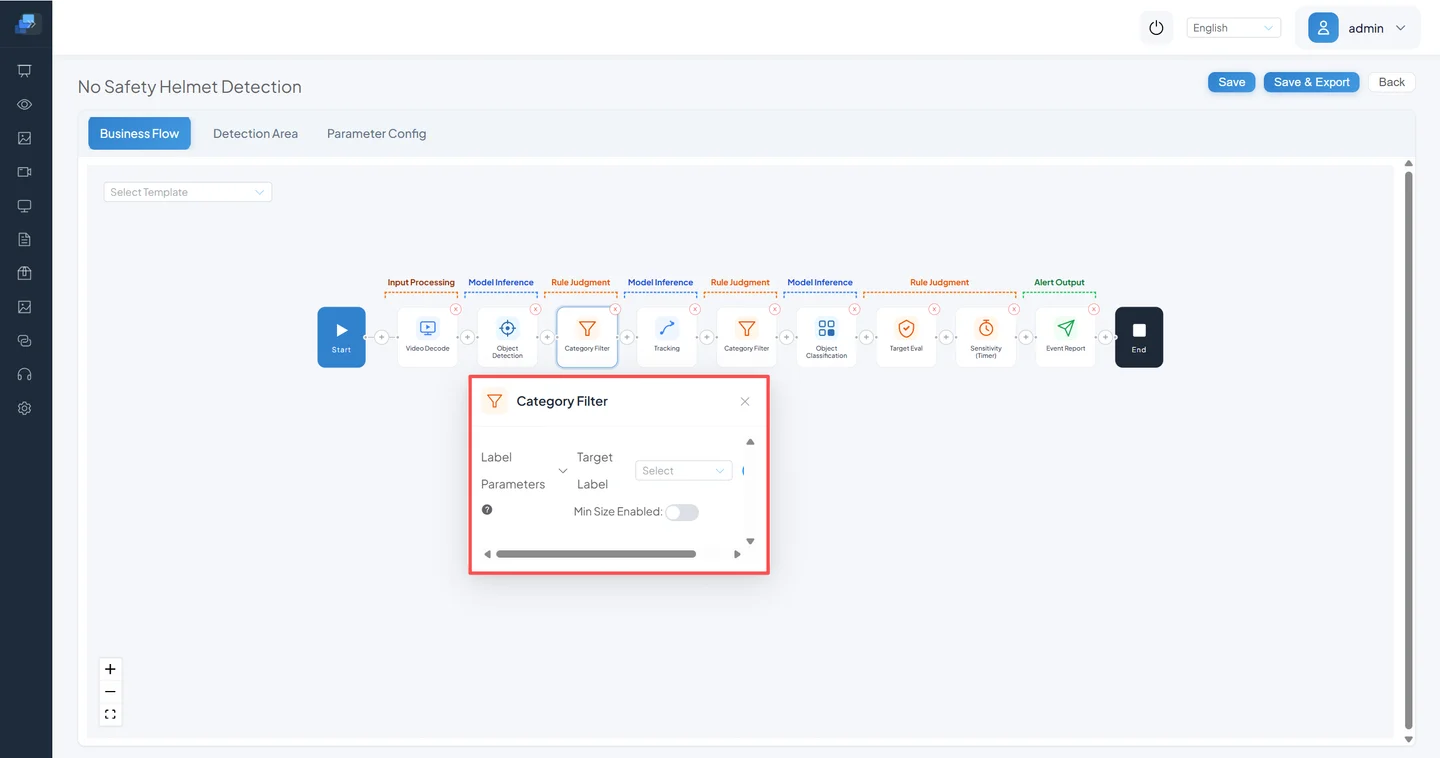
The Category Filter component has these settings:
- Target Label: Select which labels to keep.
- Enable Minimum Size: Toggle minimum size filtering on/off.
Set the target label to Pedestrian — only pedestrian results pass through; all other labels are dropped.
Enable Minimum Size — detection results below this threshold will be discarded.
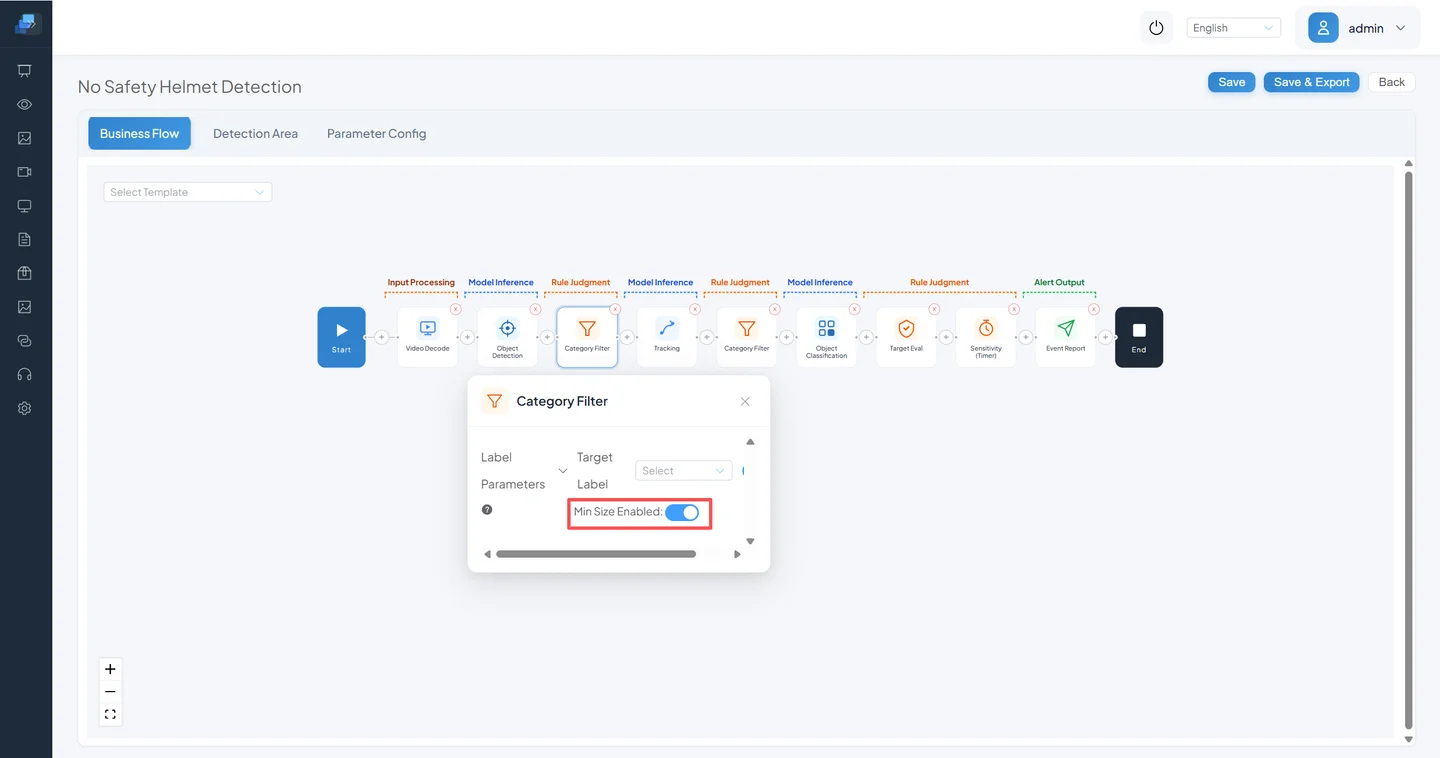
The default minimum size is 60×60 pixels. You can customize this value.
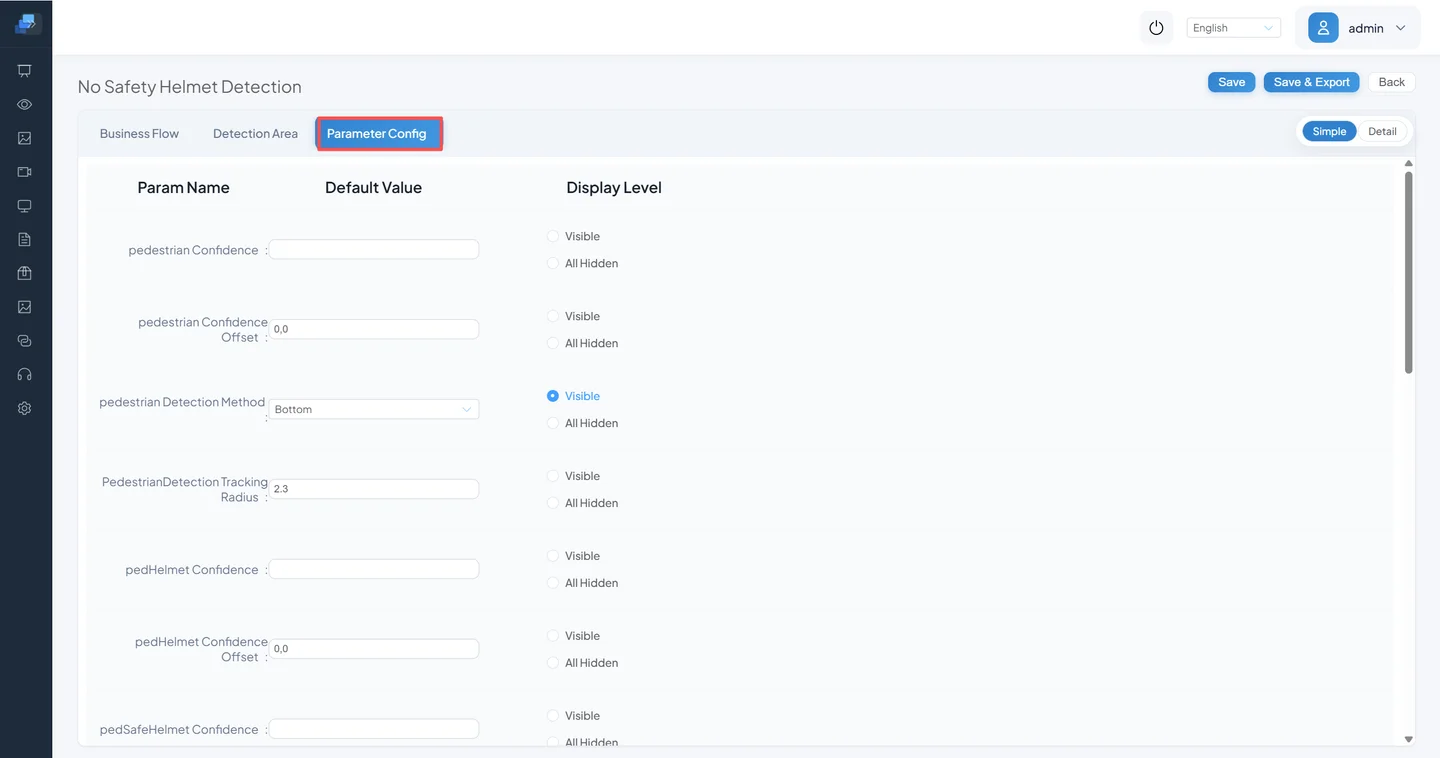
2.2 Configure Key Parameters
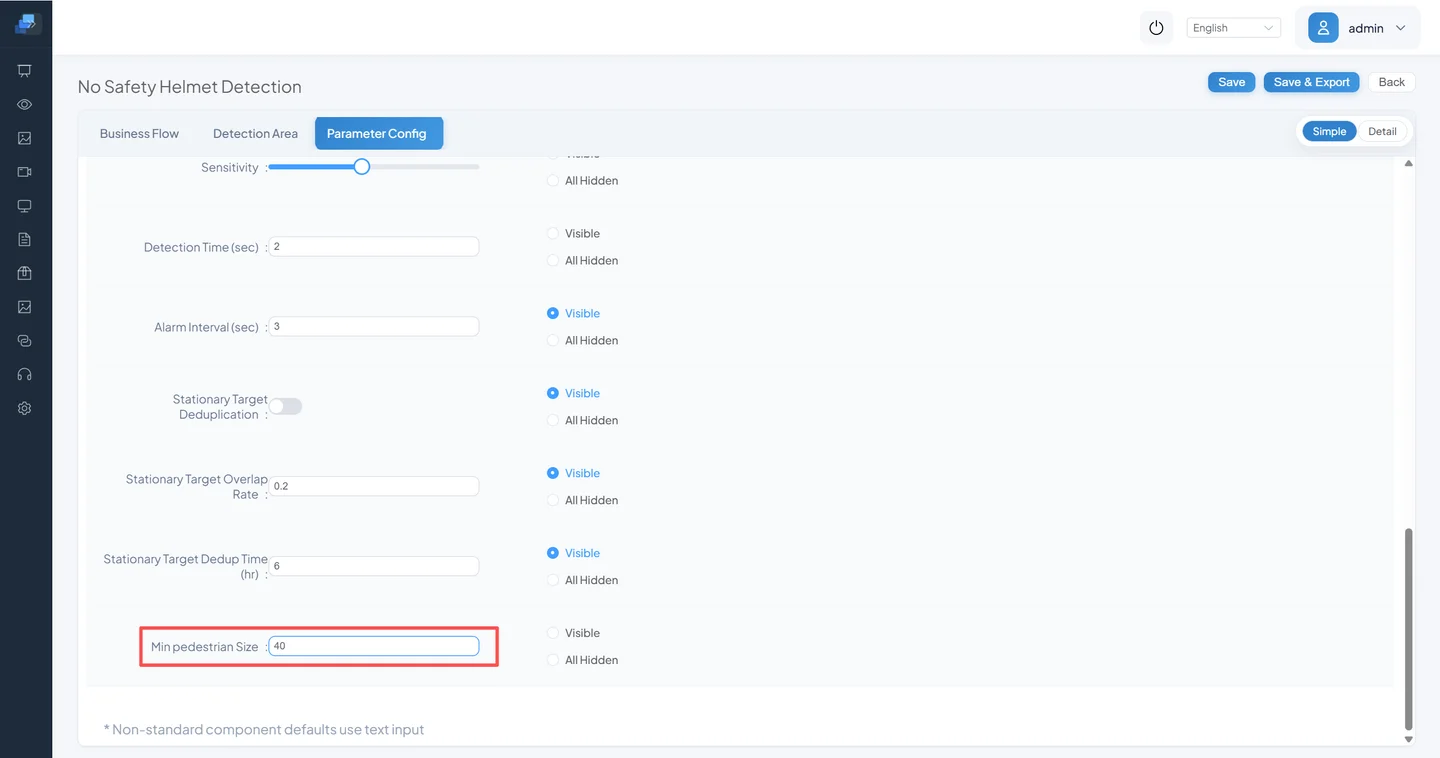
Minimum size filtering principle: When set to 60, any detection target with an area smaller than 60×60 pixels will be filtered out.
Click Parameter Configuration to open the parameter settings page.
Set Minimum Pedestrian Size to 40, meaning the minimum target area is 40×40 pixels.
Tuning advice
Start by setting the minimum size to
100to see if it's too aggressive. Then gradually decrease to40–60to find the optimal balance for your scenario.
2.4 Save and Verify
- Click Save.
- Go to Video Sources → Service Assignment and find the No Hard Hat channel.
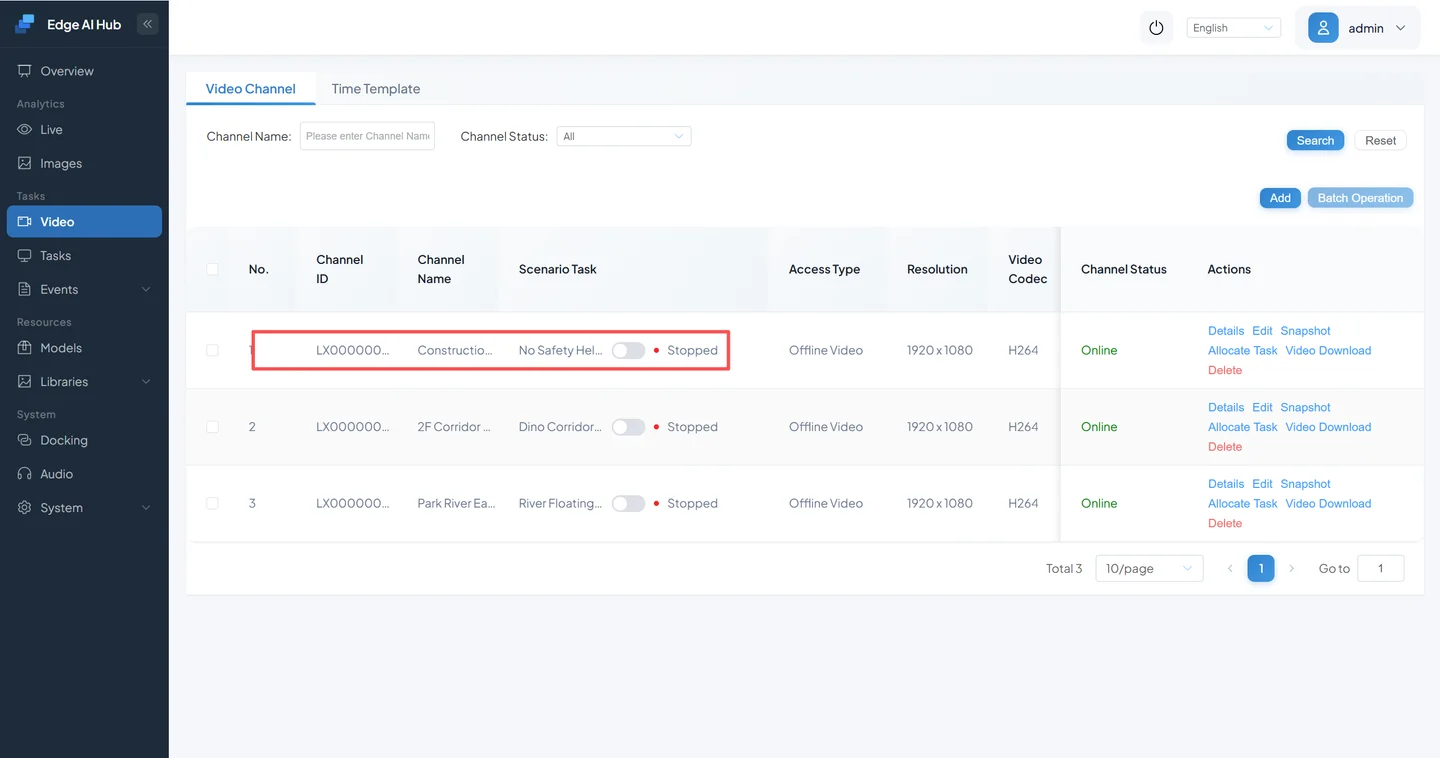
- Start the No Hard Hat service.
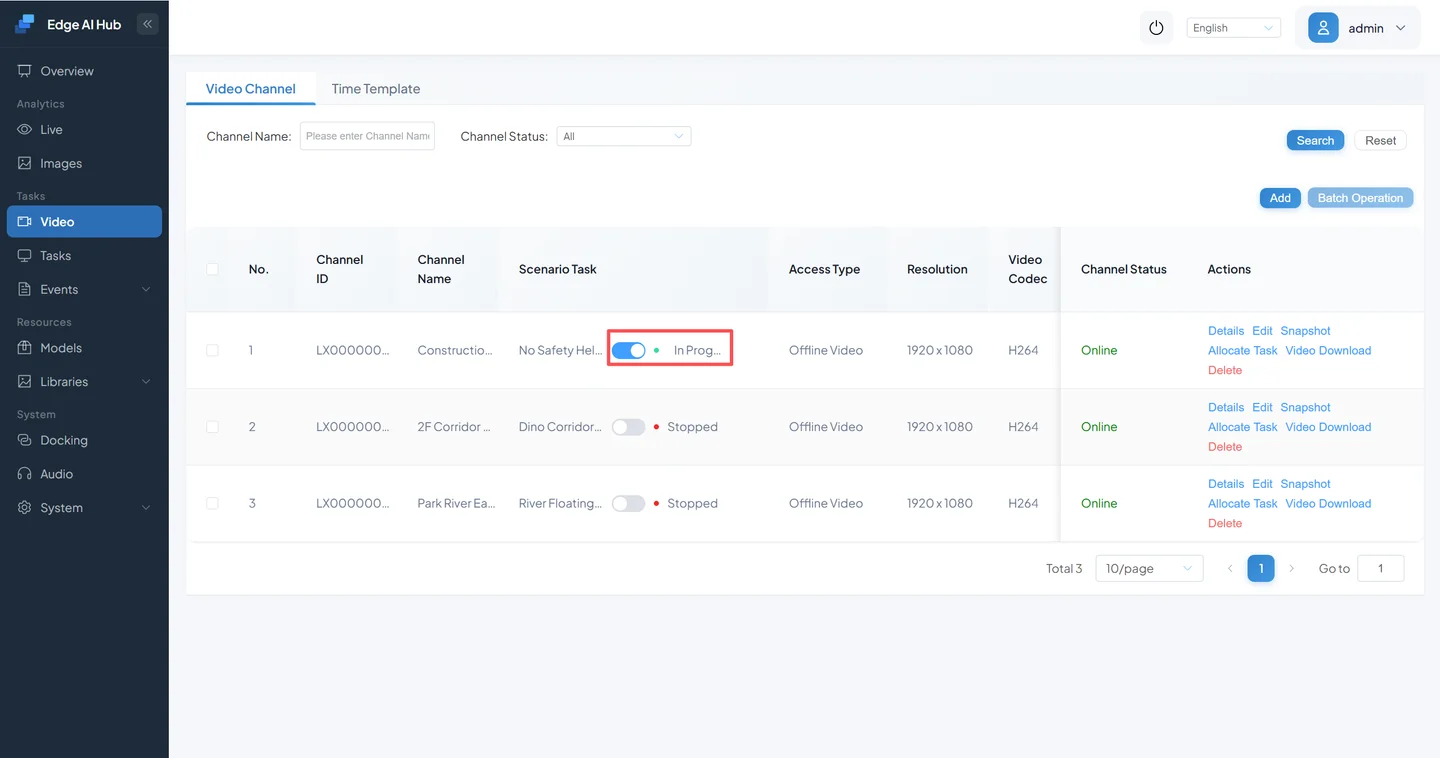
- Go to Live Preview to observe the changes.
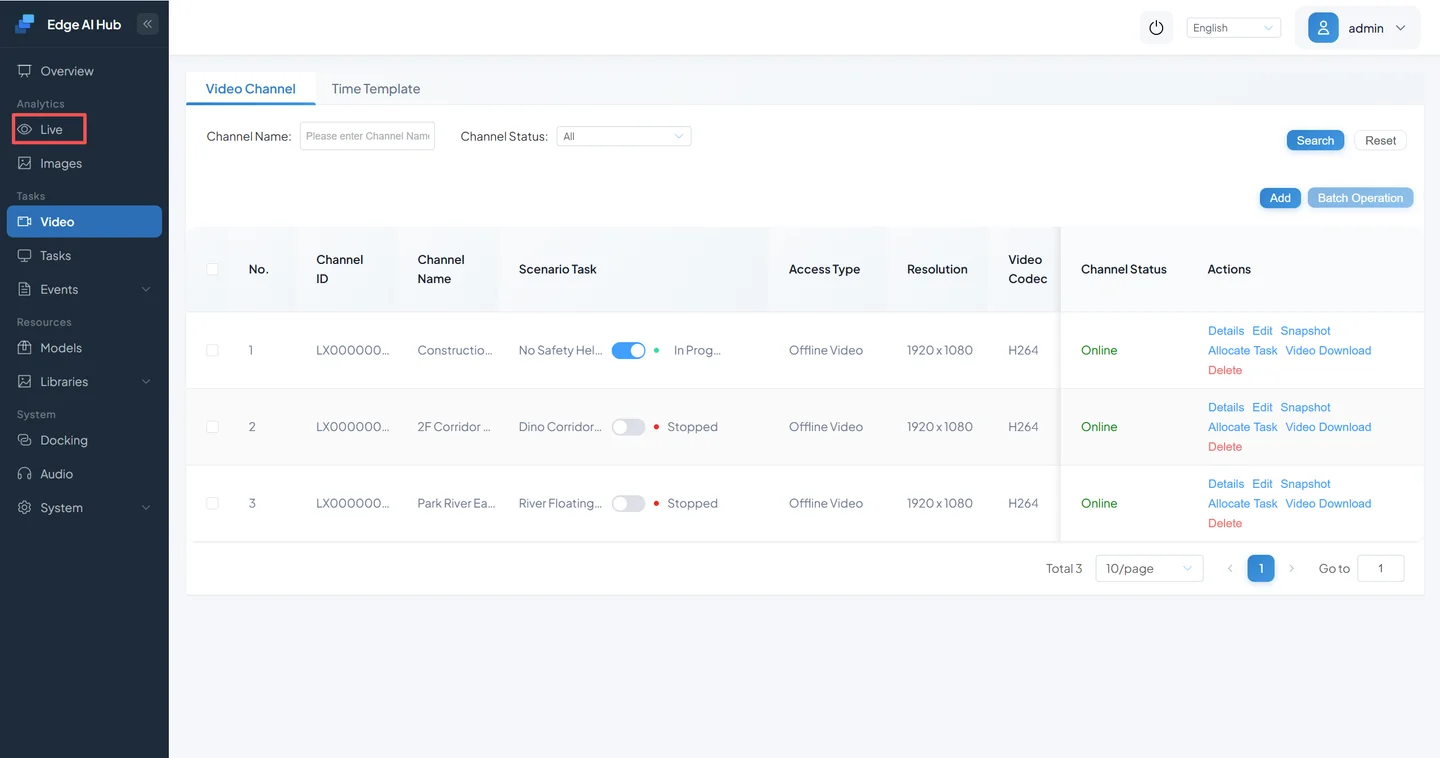
Select the Construction Site North Channel and enter full screen.
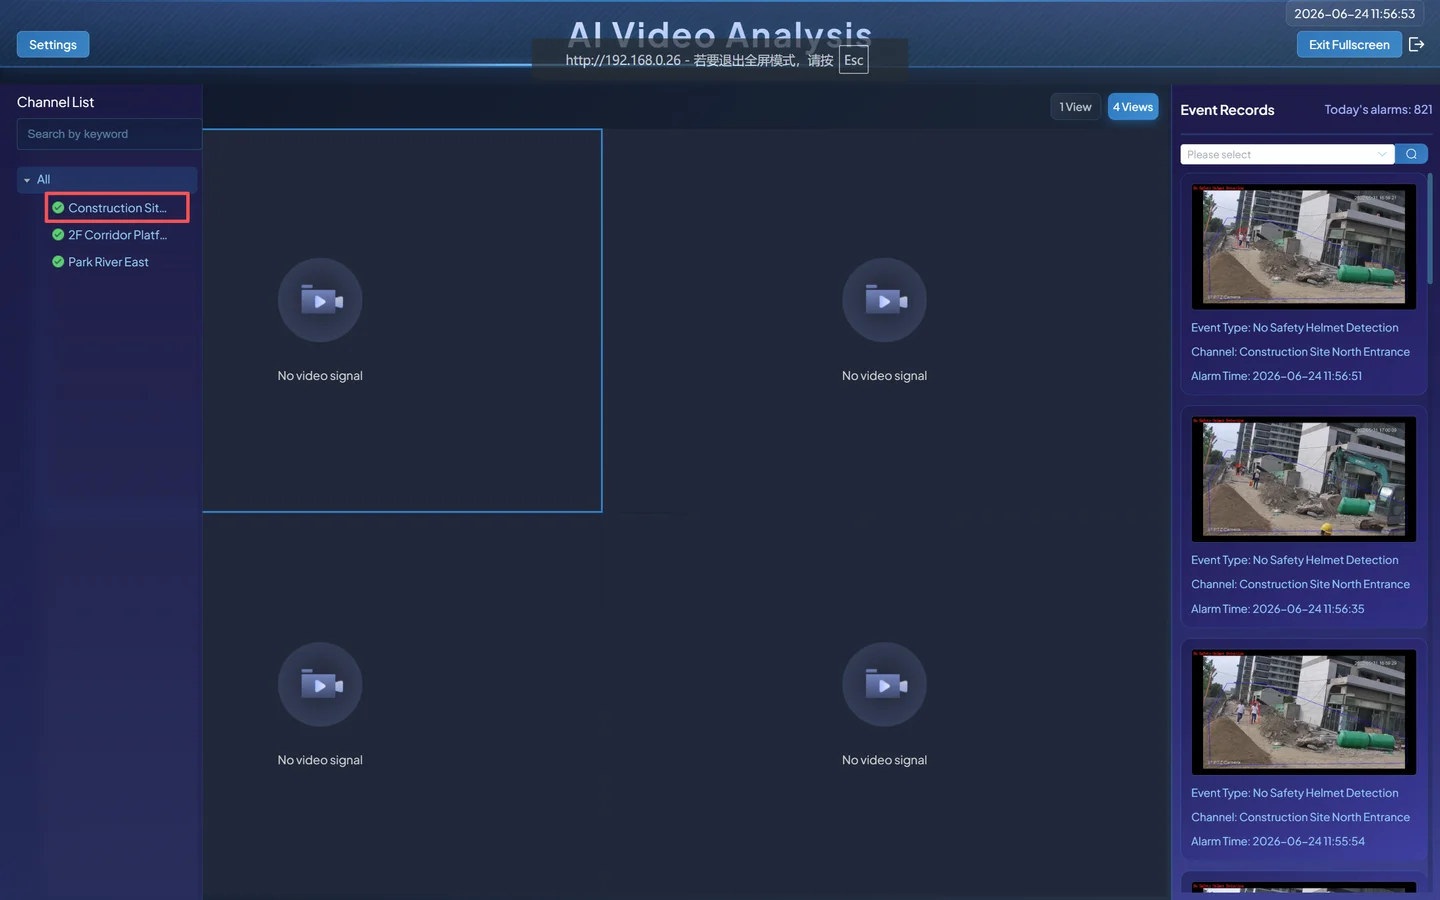
Algorithm overlay visualization:
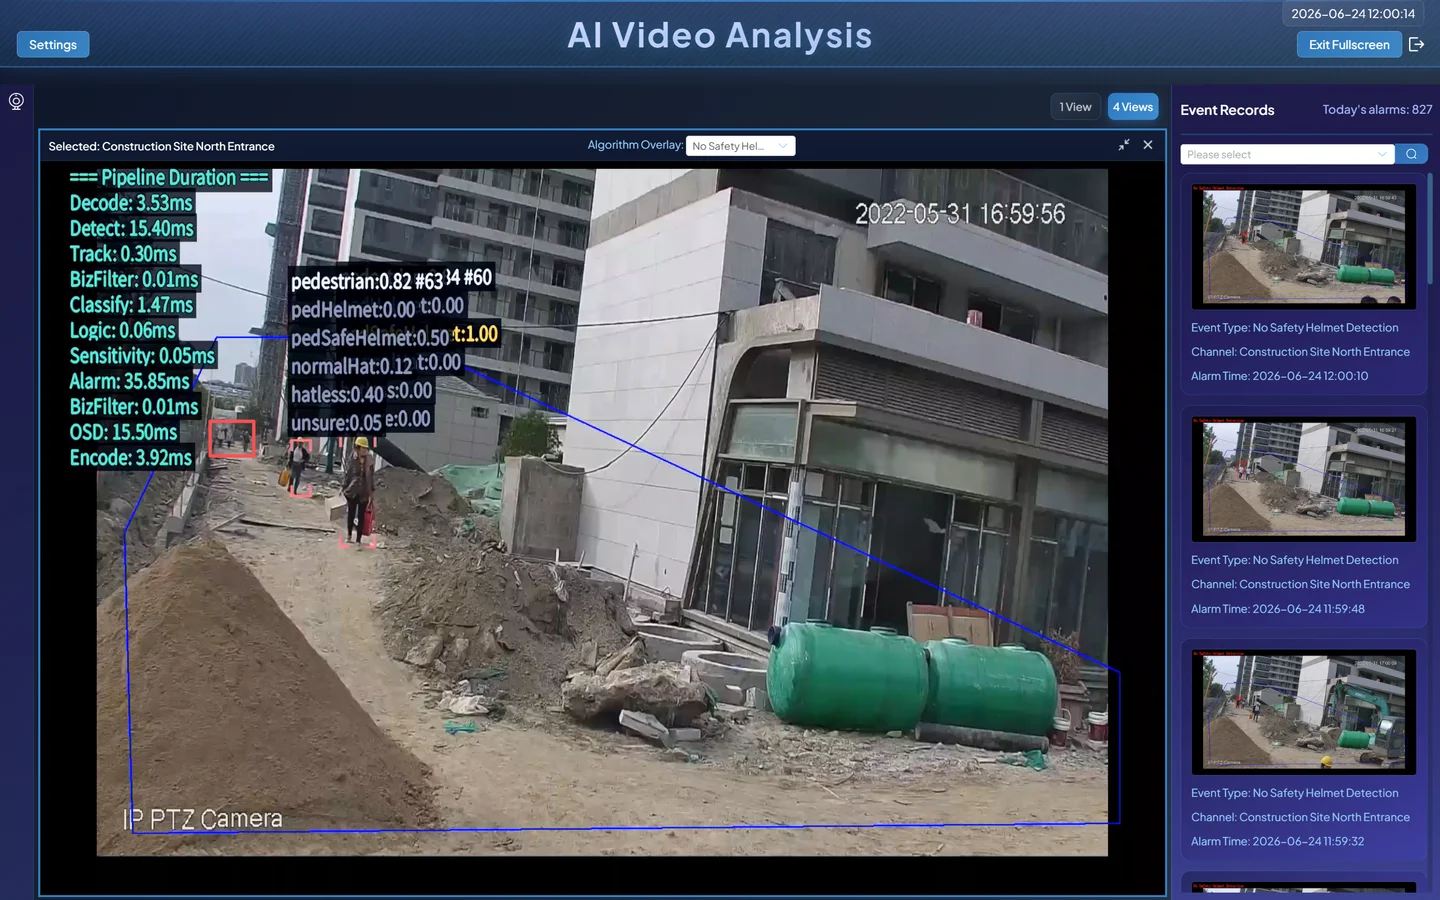
Results analysis:
- Distant, excessively small pedestrians (red box highlighted) are now noticeably fewer.
- Nearby, clearly visible targets still detect and classify normally.
- False positive count has decreased.
You've completed your first scenario task modification. This pattern will come up repeatedly:
Open existing scenario task → Add/remove nodes → Configure parameters → Save → VerifyChapter 3: Building a New Scenario Task from Scratch
Chapters 1 and 2 covered "reading" and "modifying." This chapter tackles "building."
We'll still follow the "reference existing structure" method rather than starting from a completely blank slate.
Scenario Description
Create a new Zone Intrusion Detection scenario task:
- Detect people in the frame
- Determine whether they've entered a specified zone
- Trigger an alarm after consecutive detections
- Display bounding boxes and labels in the live preview
Two advantages of this example:
- Uses only built-in capabilities — low barrier to entry
- Covers the complete loop: detection + zone rules + alarm + visualization
3.1 Create a New Algorithm
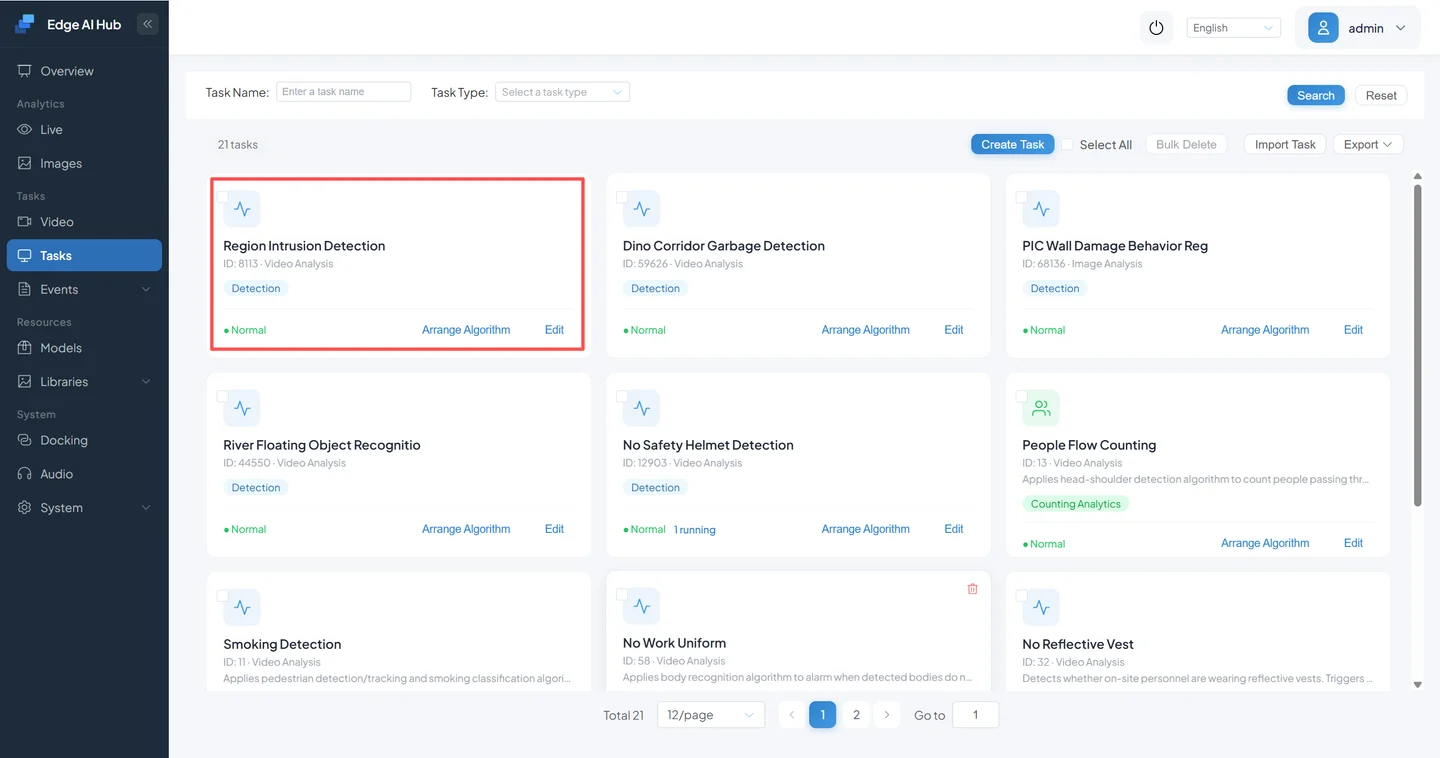
- Navigate to Scenario Tasks.
- Click New Task.
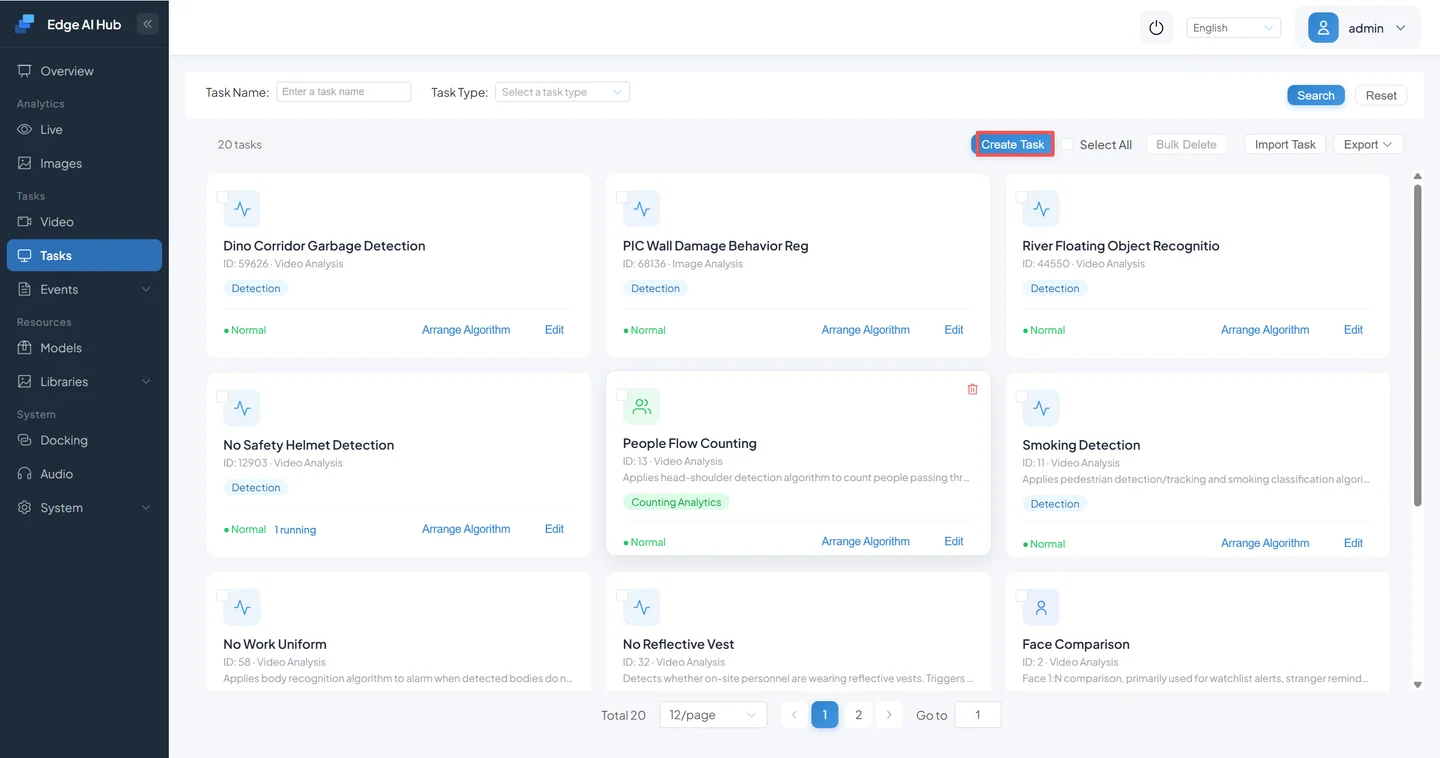

- Fill in the basic information:
| Field | Value |
|---|---|
| Task Name | Zone Intrusion Detection |
| Data Source Type | Video Analysis |
| Task Type | Detection/Analysis |
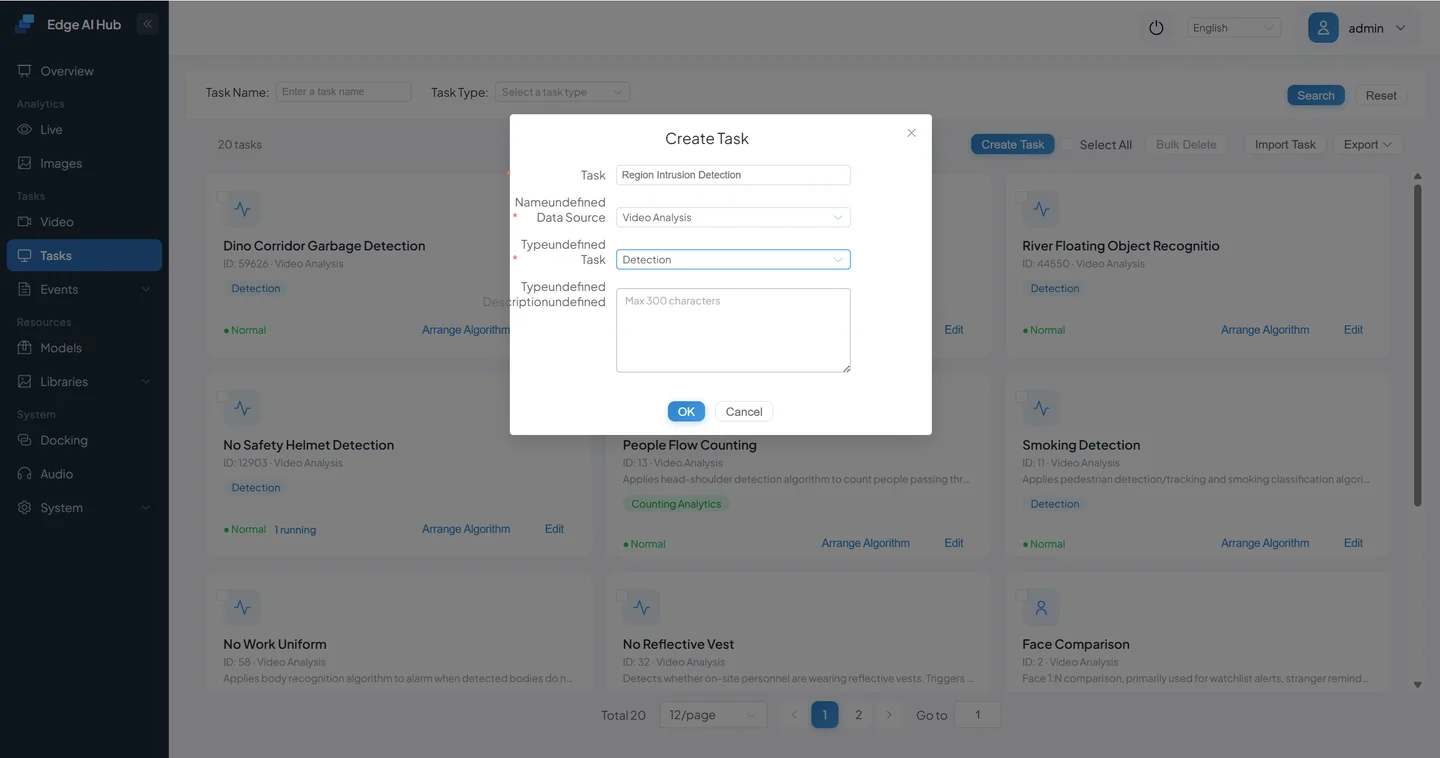
Click OK to save.
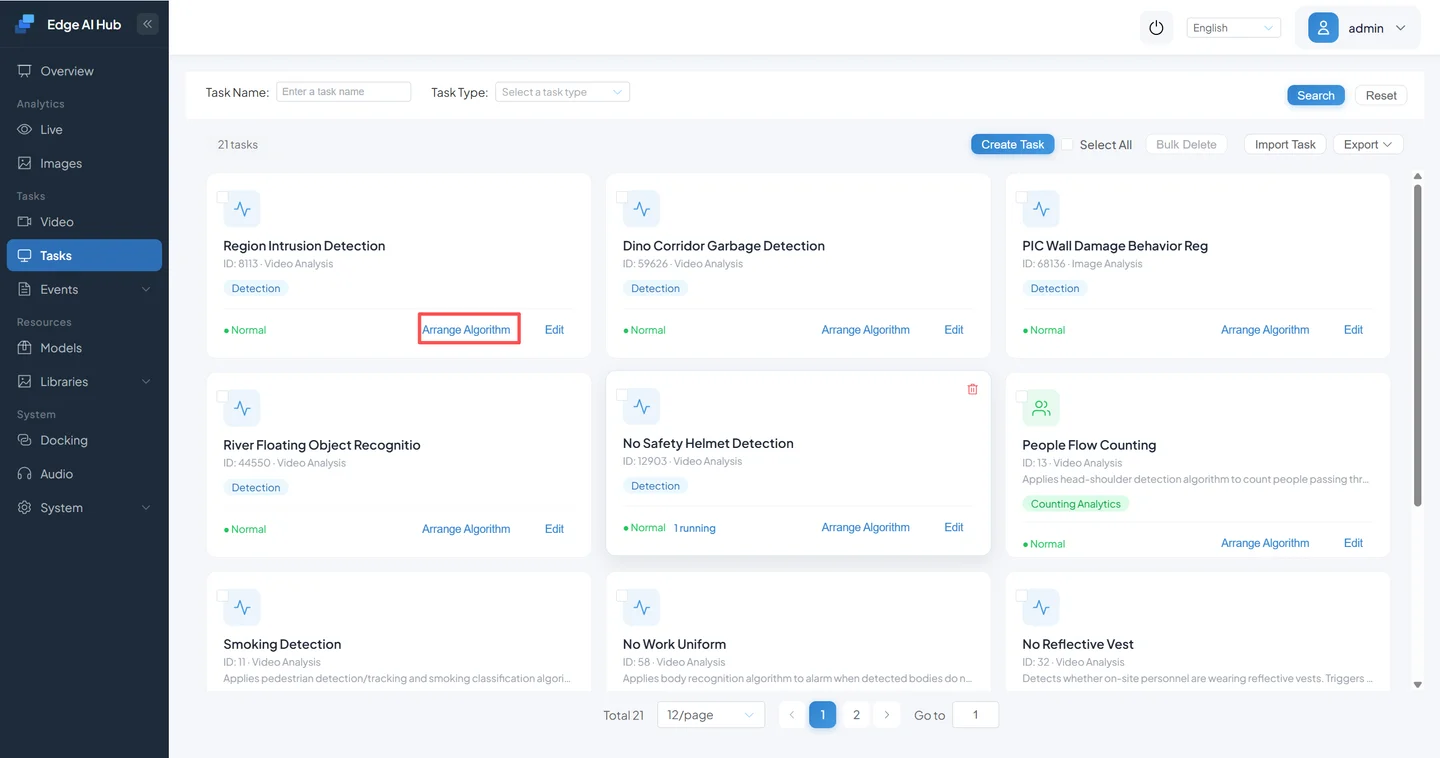
3.2 Build the Pipeline
Preparation
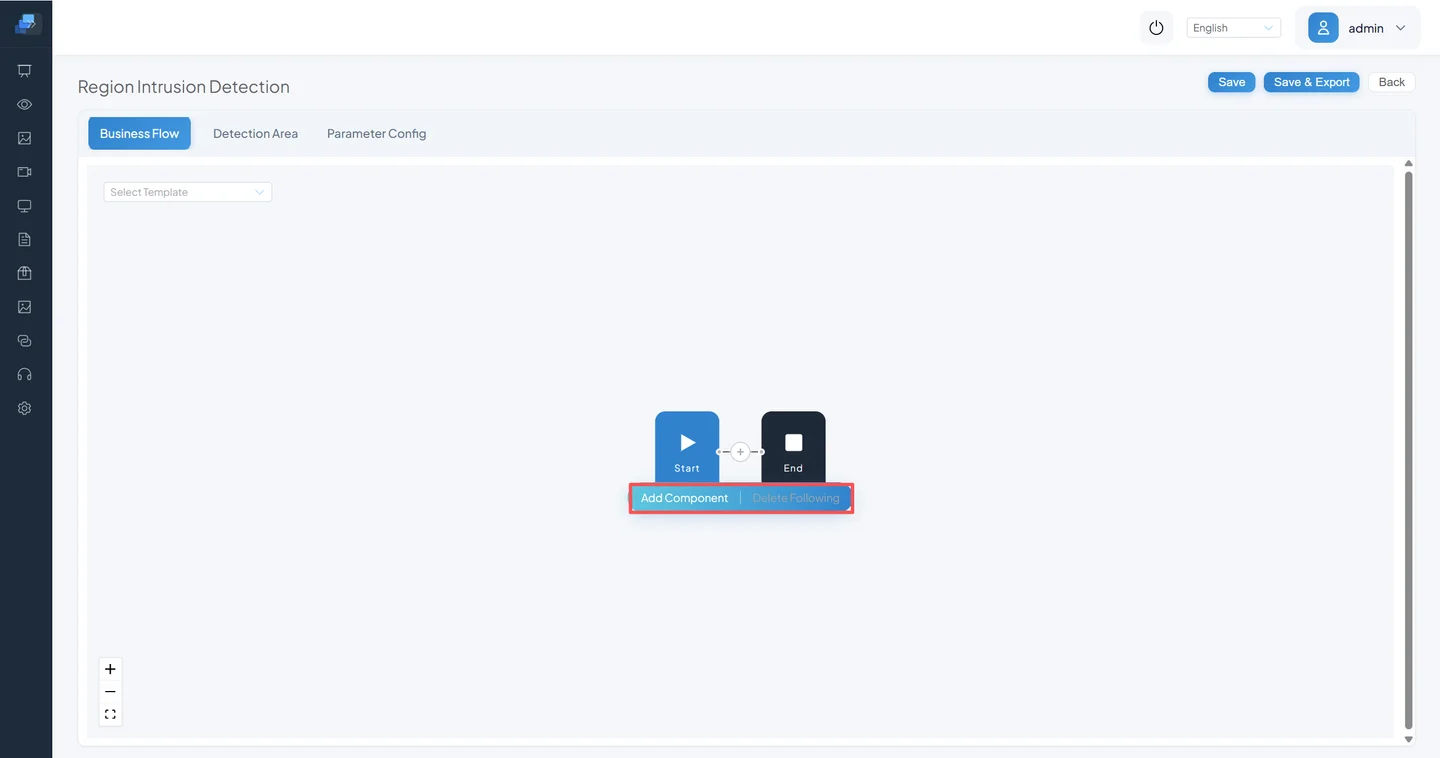
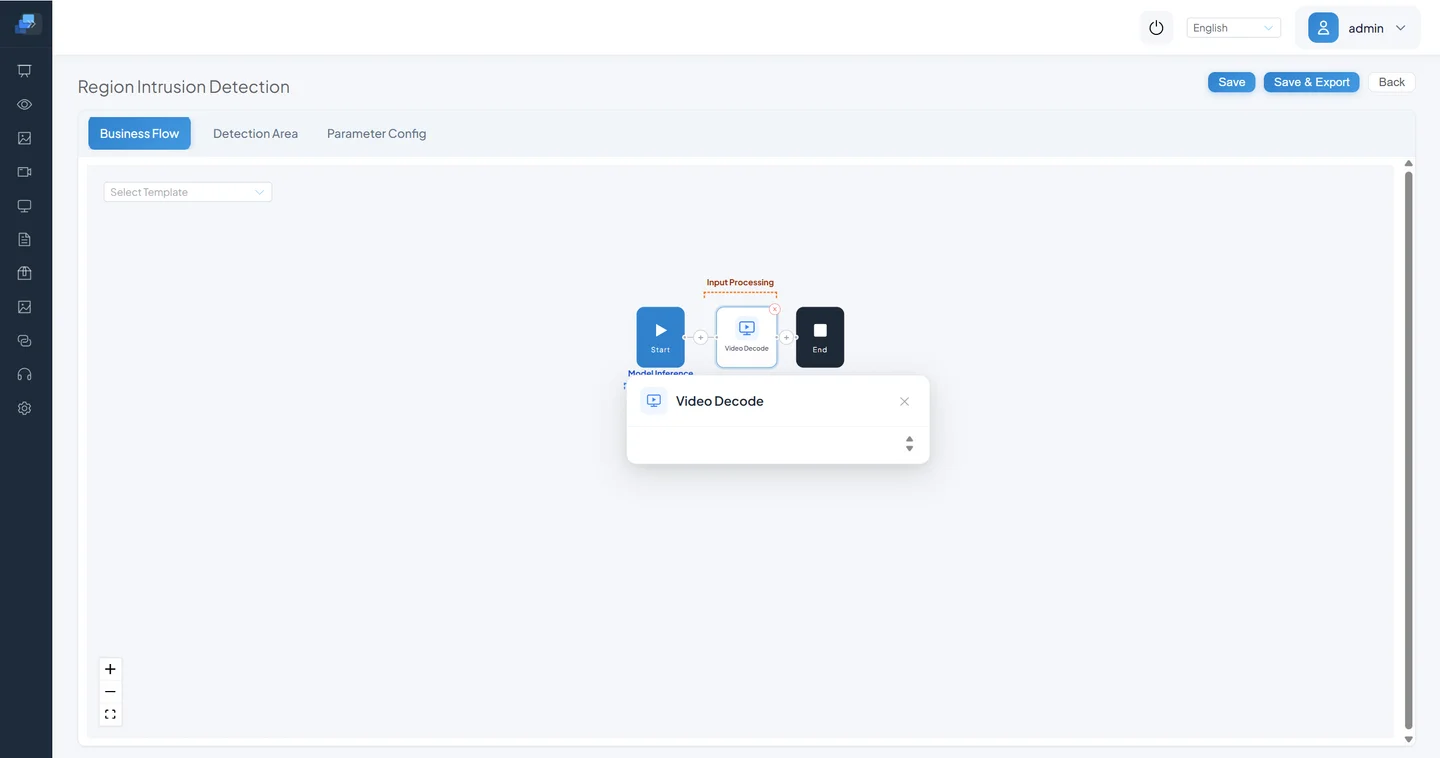
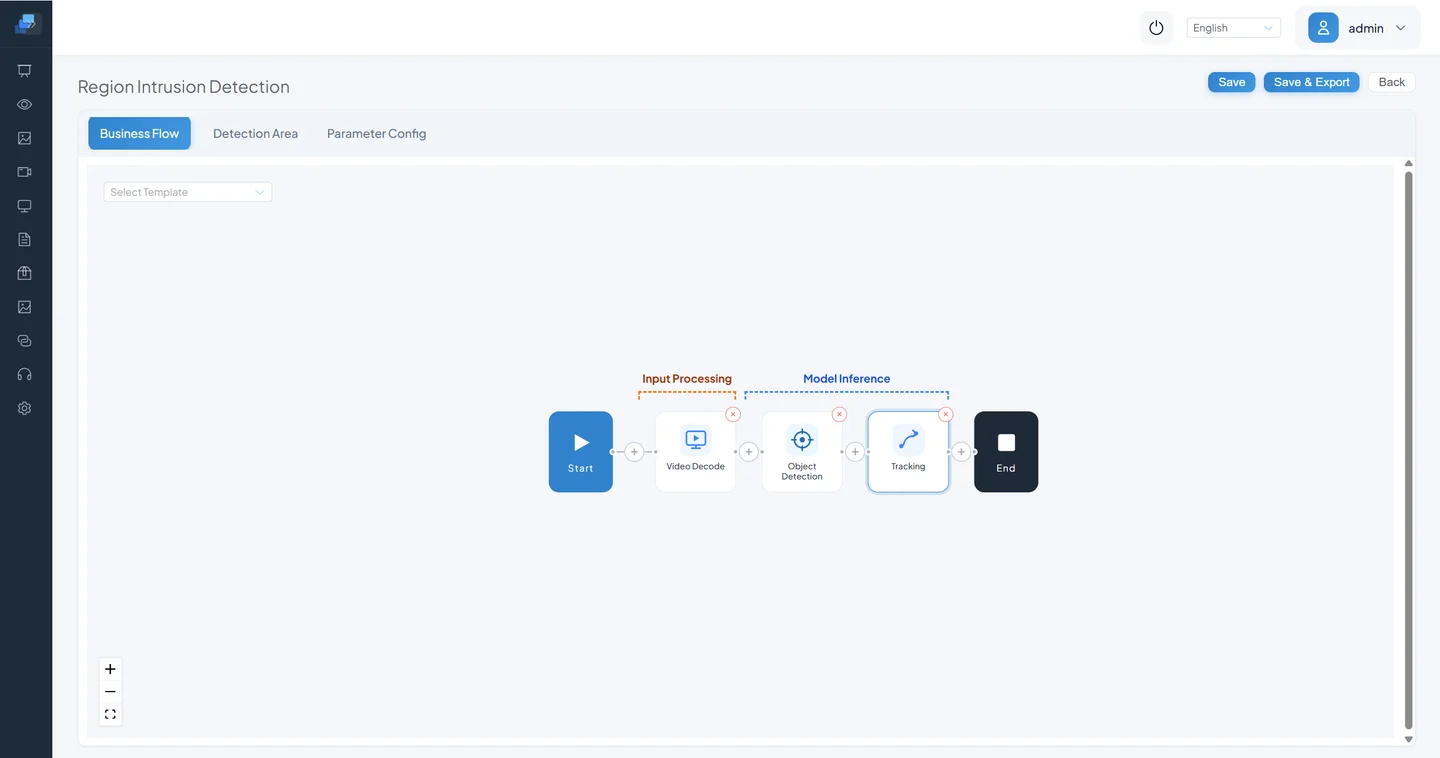
Click Pipeline Orchestration to enter the blank orchestration page.
An empty pipeline contains only the Start and End nodes.
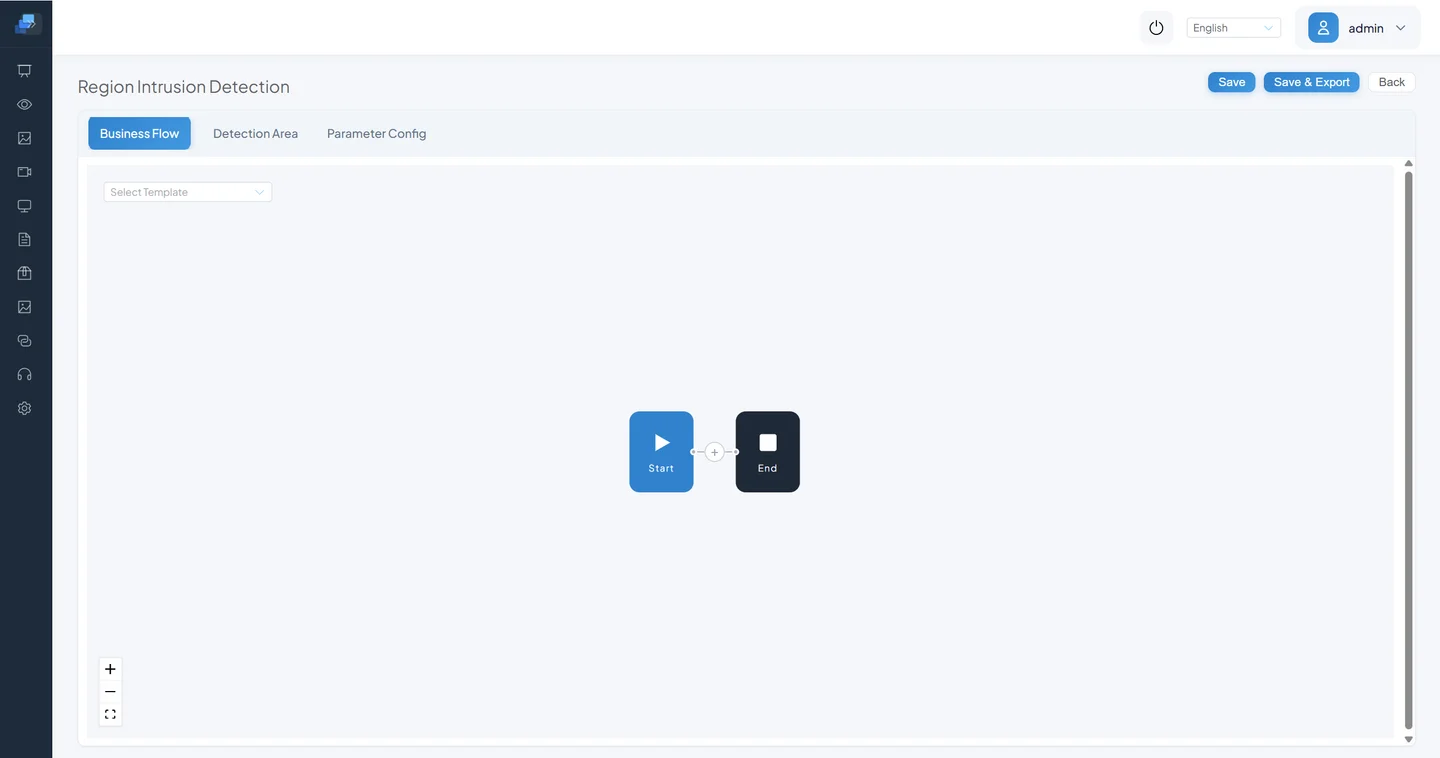
The plus button between nodes is used to add components.

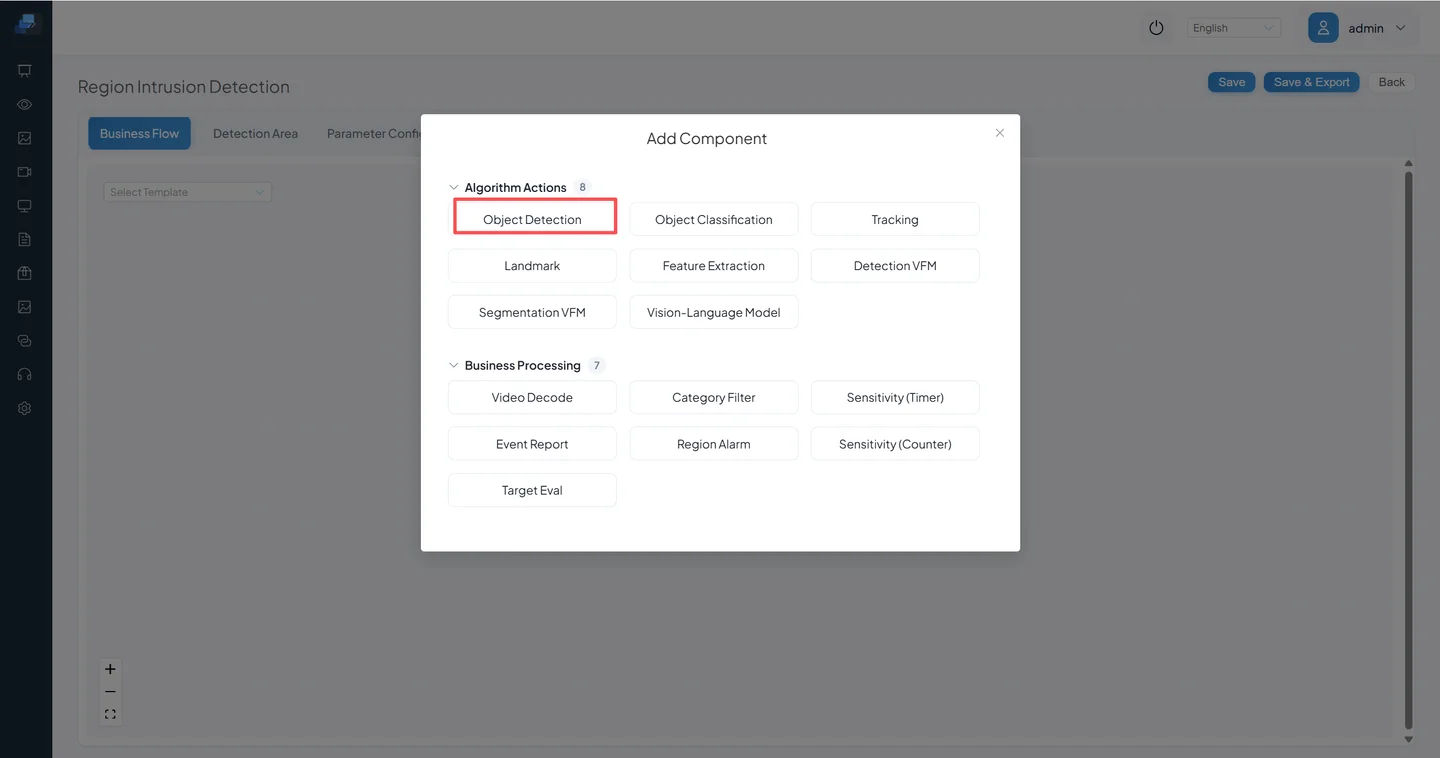
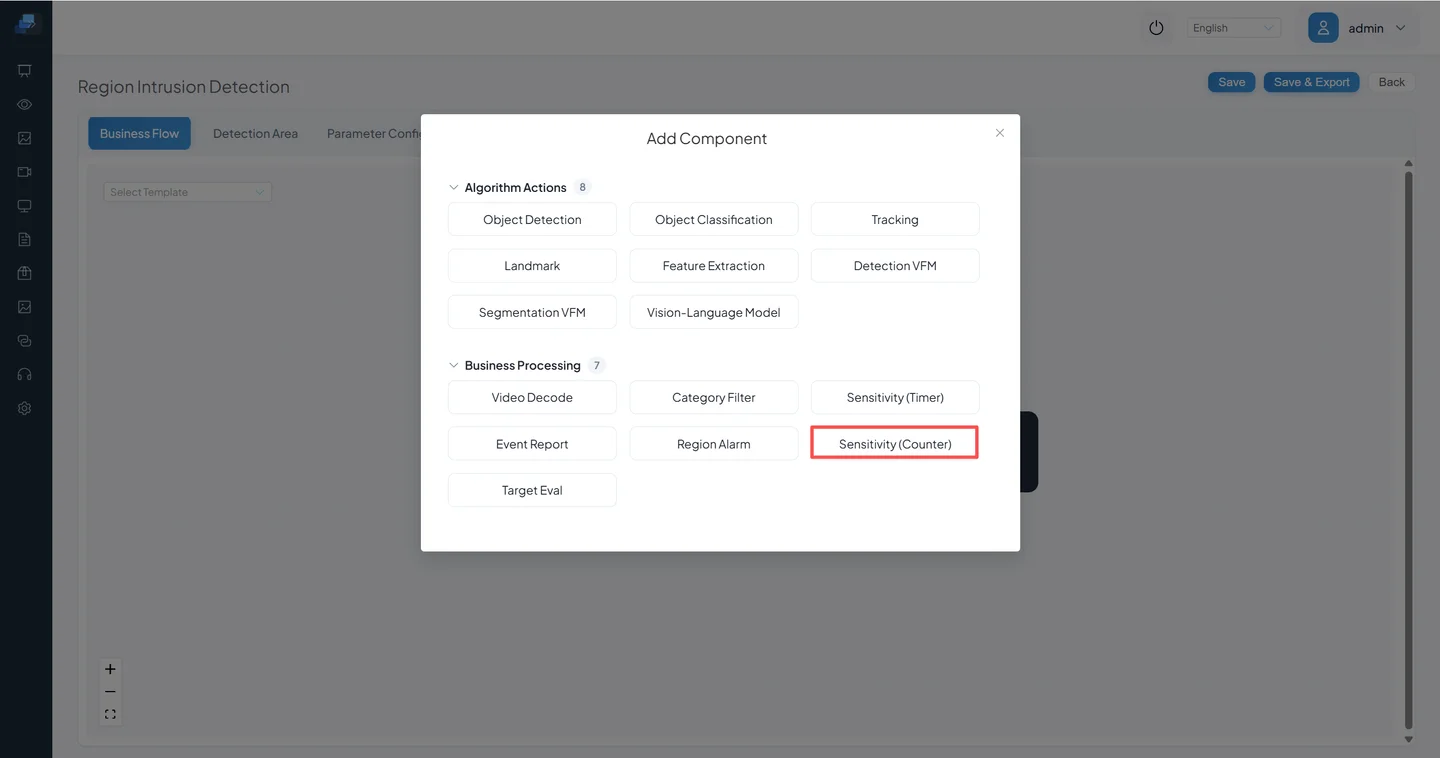
Click the plus button to see the operation options. Add Component inserts algorithm components.
Click Add Component to open the component panel. For detailed component information, see Appendix A: Node Quick Reference.
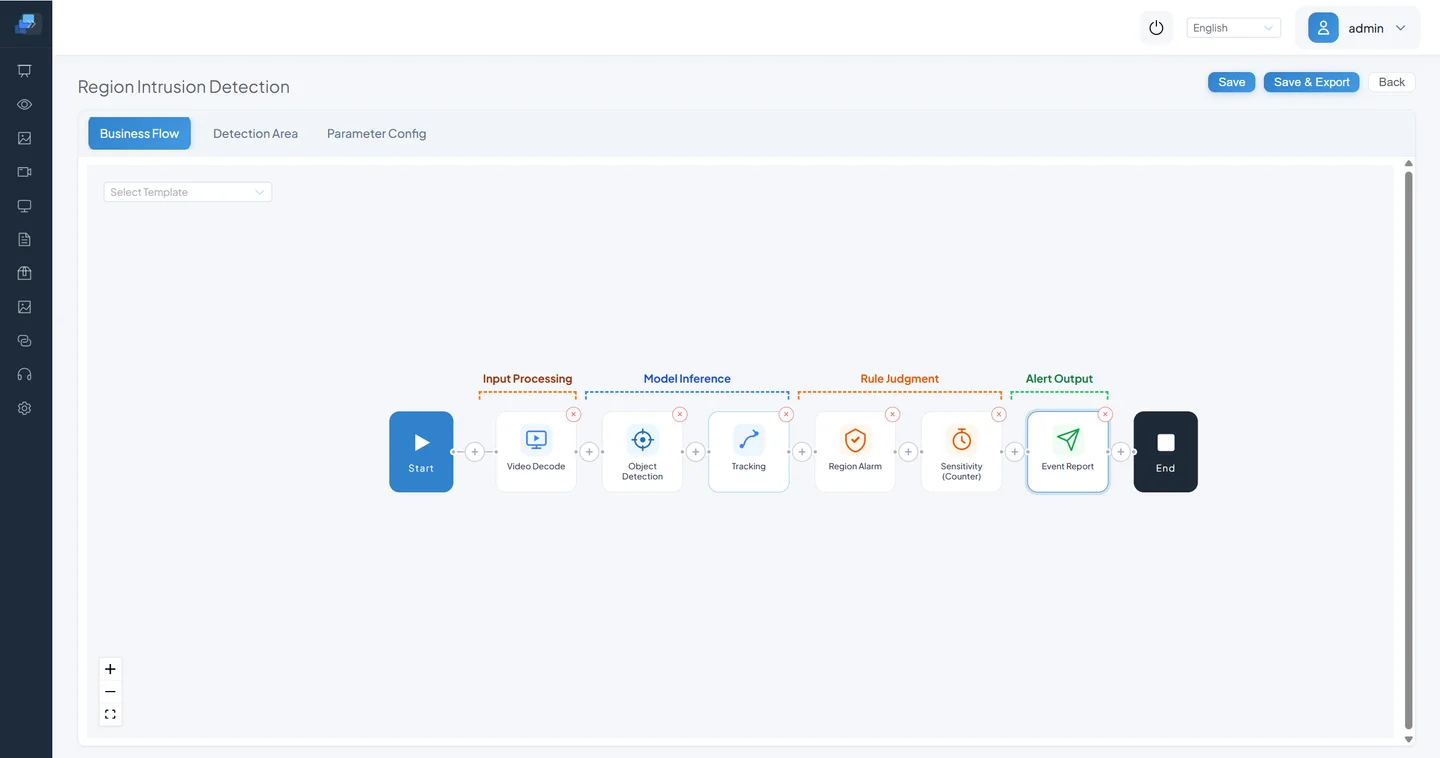
Add nodes in the following order:
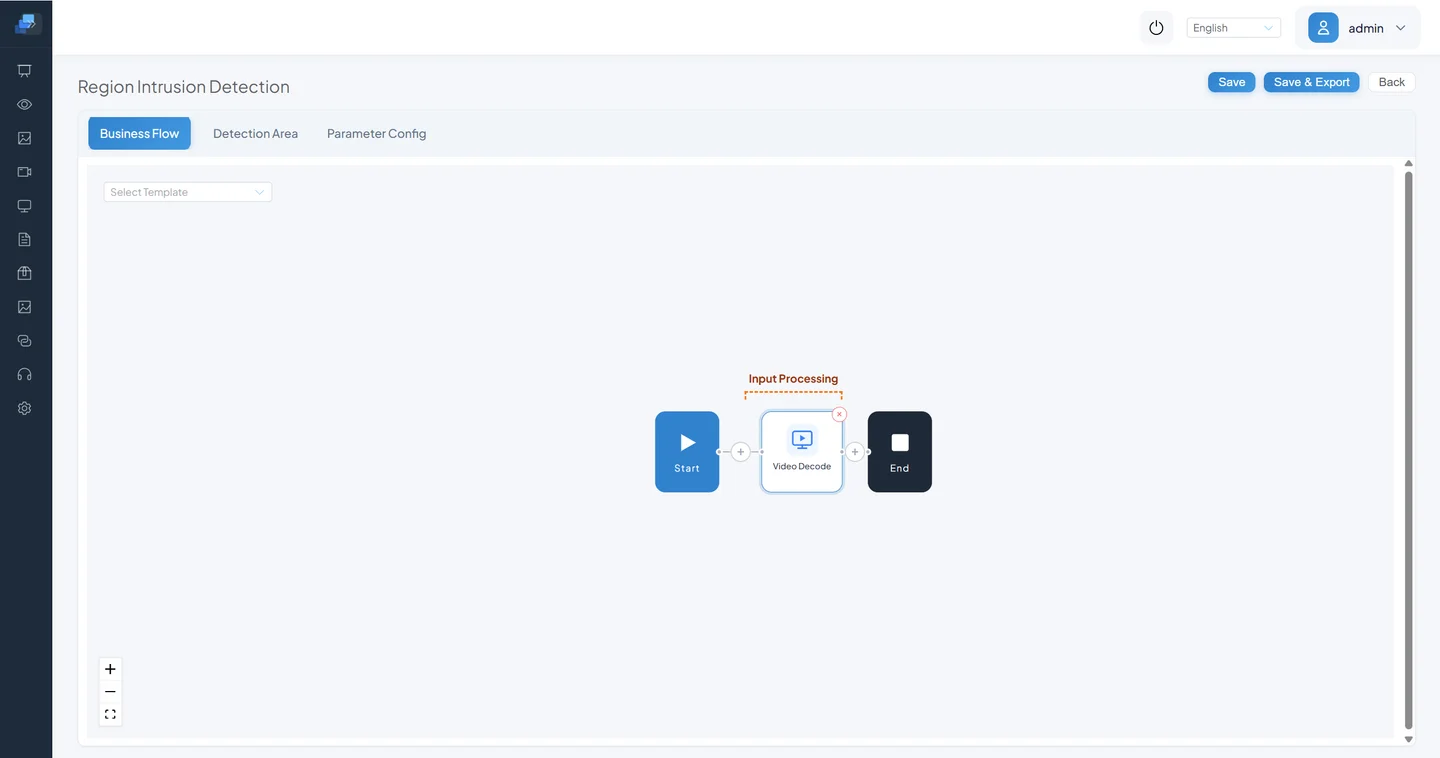
Video Decode → Object Detection → Object Tracking → Region Judgment → Sensitivity Calculation → Event ReportingStep 1: Add Video Decode
The Video Decode node is the starting point for every scenario task. It converts a video stream into individual frames.
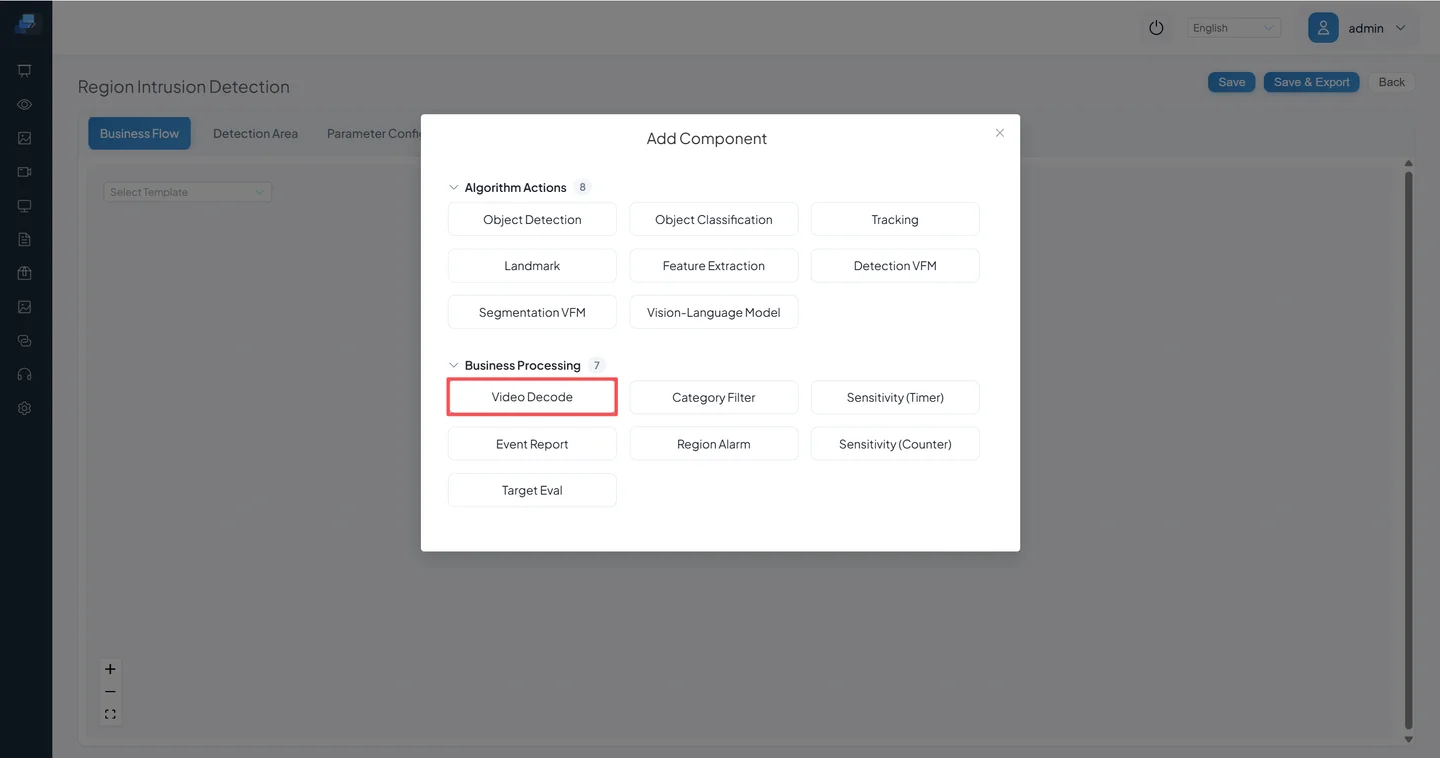
Business logic configuration: Click Video Decode to view configuration options. Video decode has no configurable parameters, so the panel is empty.
Step 2: Add Object Detection
Decoded frames are fed into the object detection model, which outputs target positions and class information.

Business logic configuration:
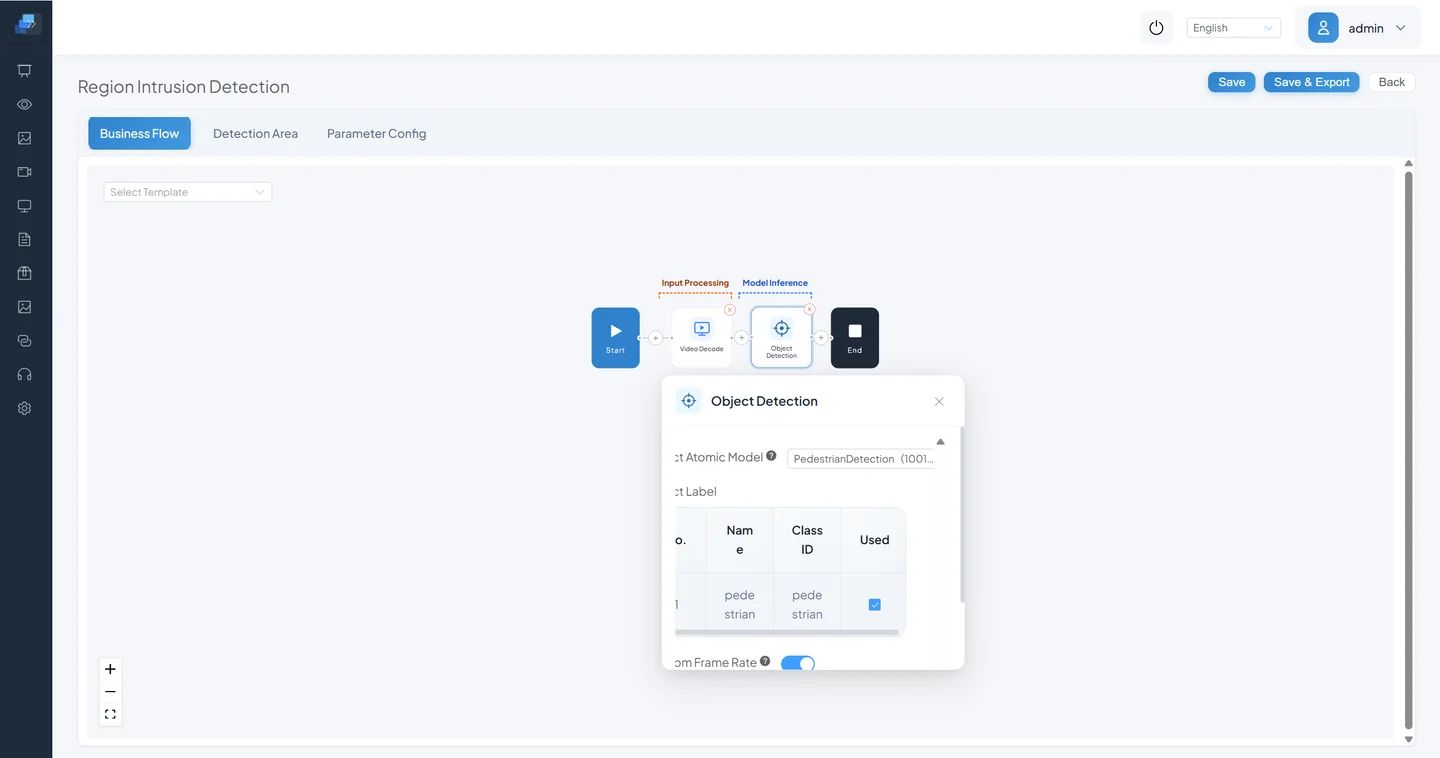
- Base Model: PedestrianDetection (Pedestrian Detection Model)
- Select Label: Pedestrian
- Custom Frame Rate: Enabled
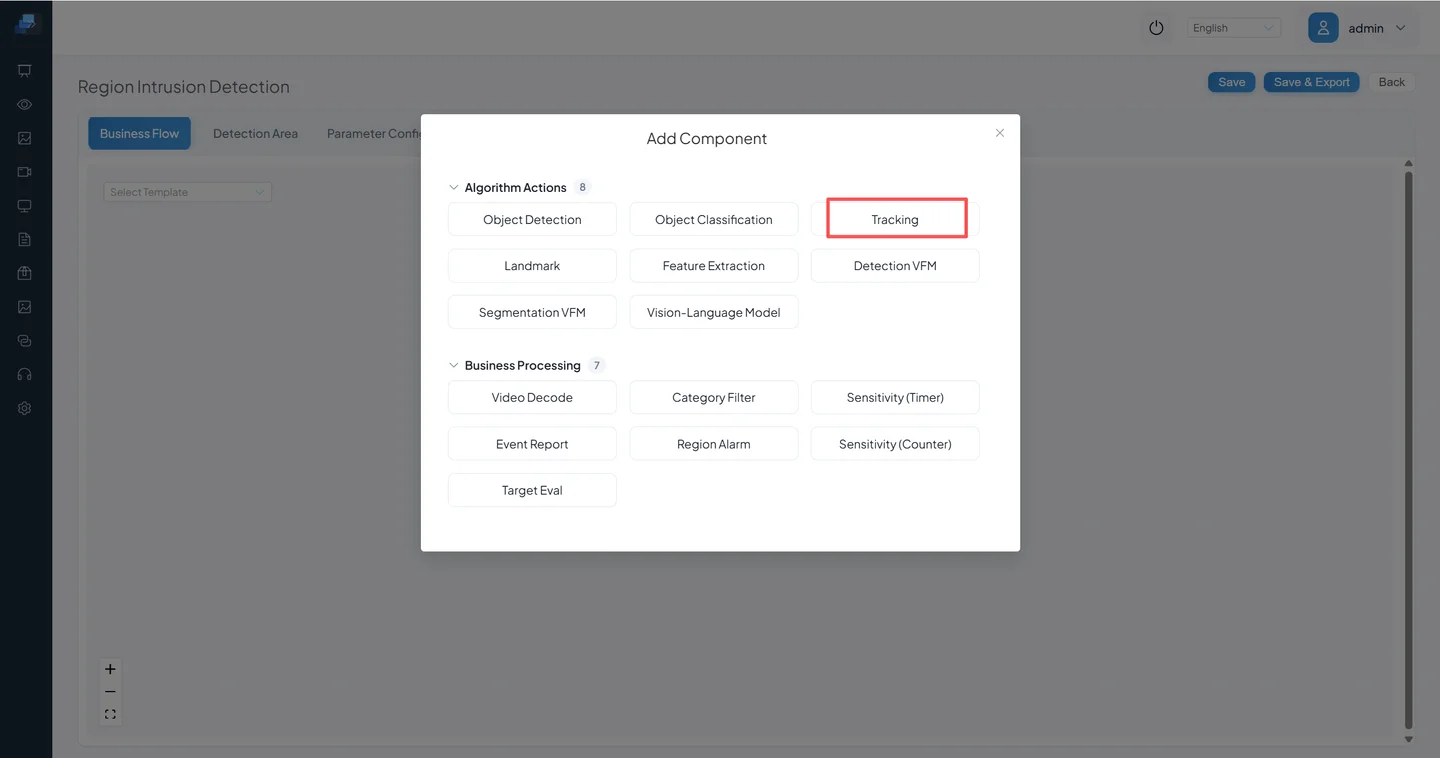
Step 3: Add Object Tracking
Track detected targets across frames so the same person maintains a consistent identity, providing stable IDs for downstream business logic.
Business logic configuration:
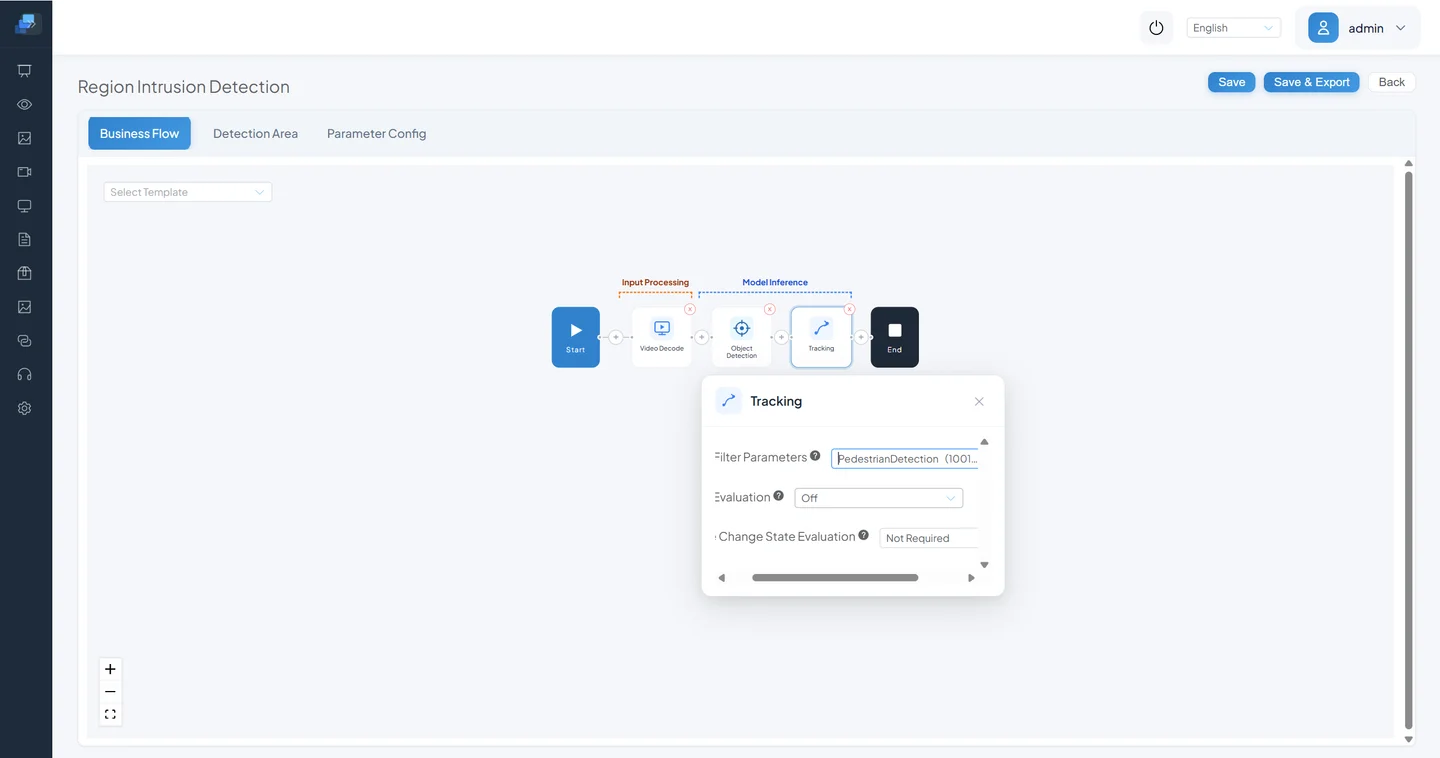
- Label Filter: PedestrianDetection — track this label
- State Judgment: Motion state
- Deformation Judgment: Not required
Step 4: Add Region Judgment
Draw a zone that defines the intrusion boundary — entering this zone triggers an alarm event.
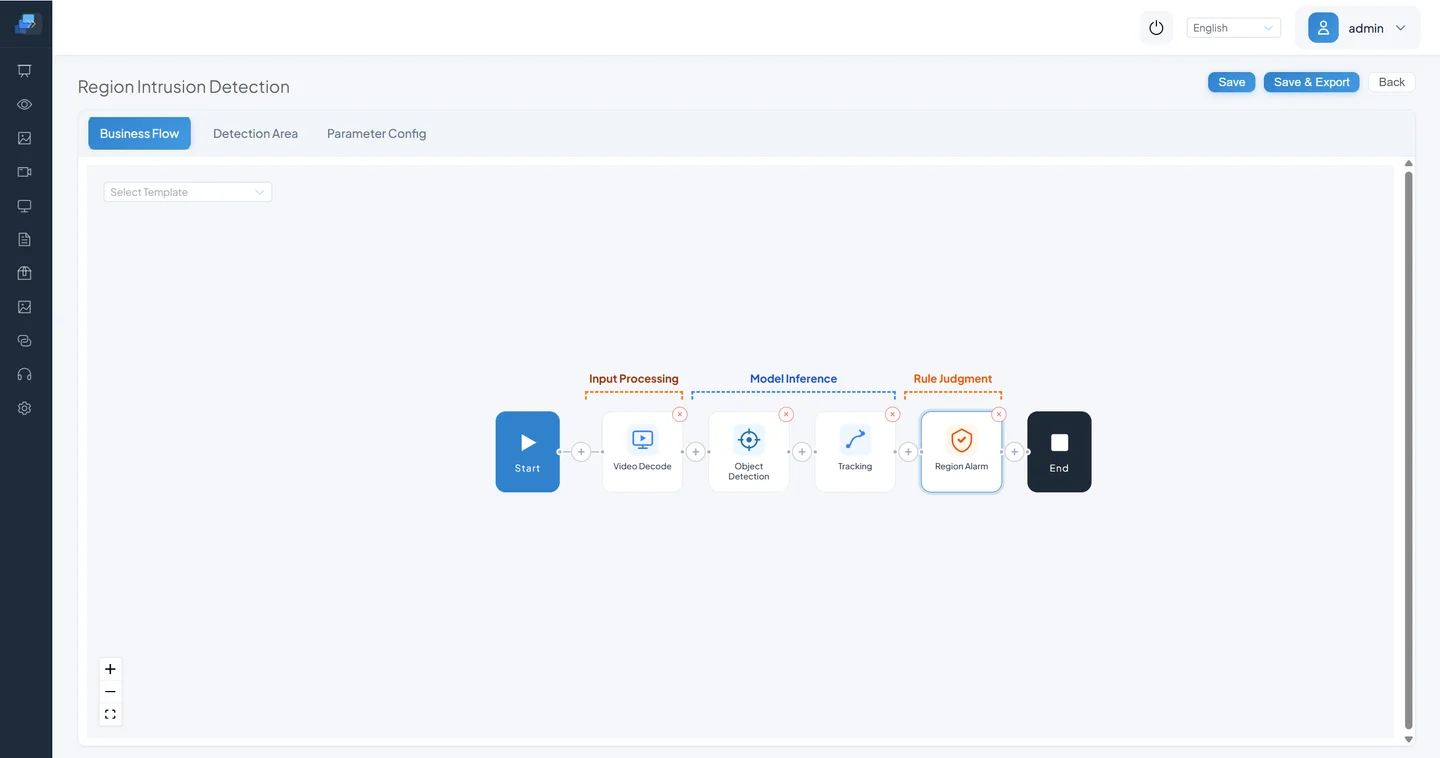
Business logic configuration:
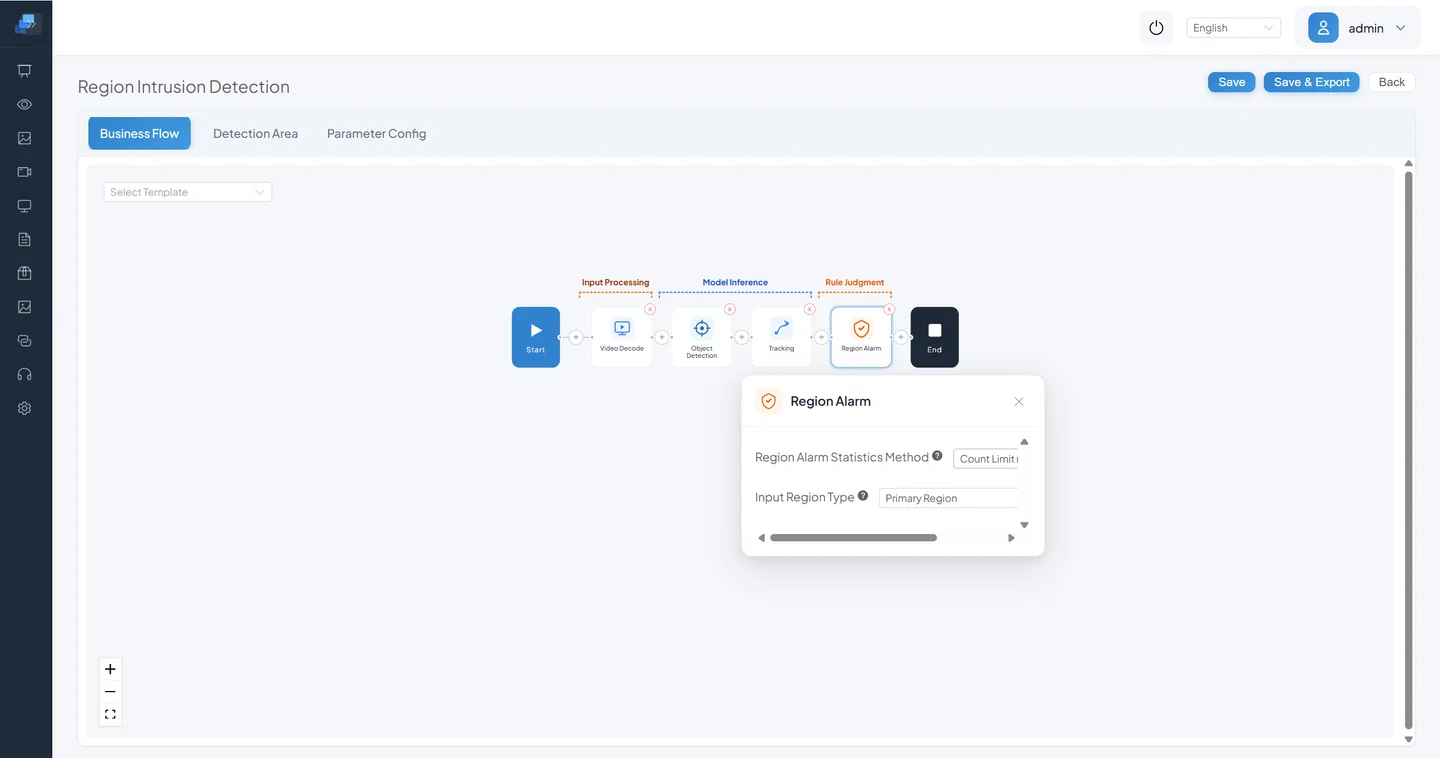
- Region Alarm Statistic Mode: Count limit (for absence/gathering detection)
- Input Region Type: Primary region
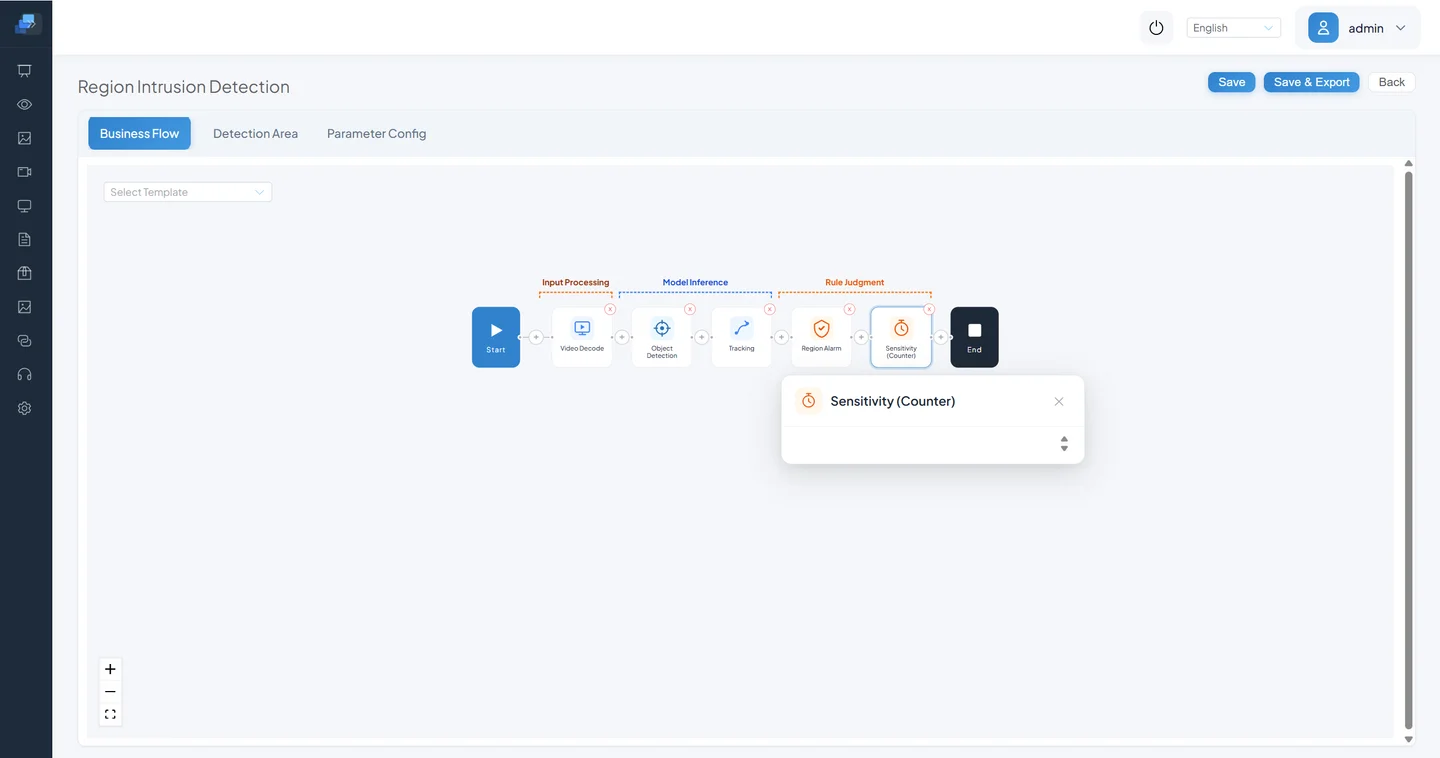
Step 5: Add Sensitivity Calculation
Single-frame alarms have high false positive rates. Sensitivity calculation requires multiple consecutive frame hits before triggering, significantly reducing noise.
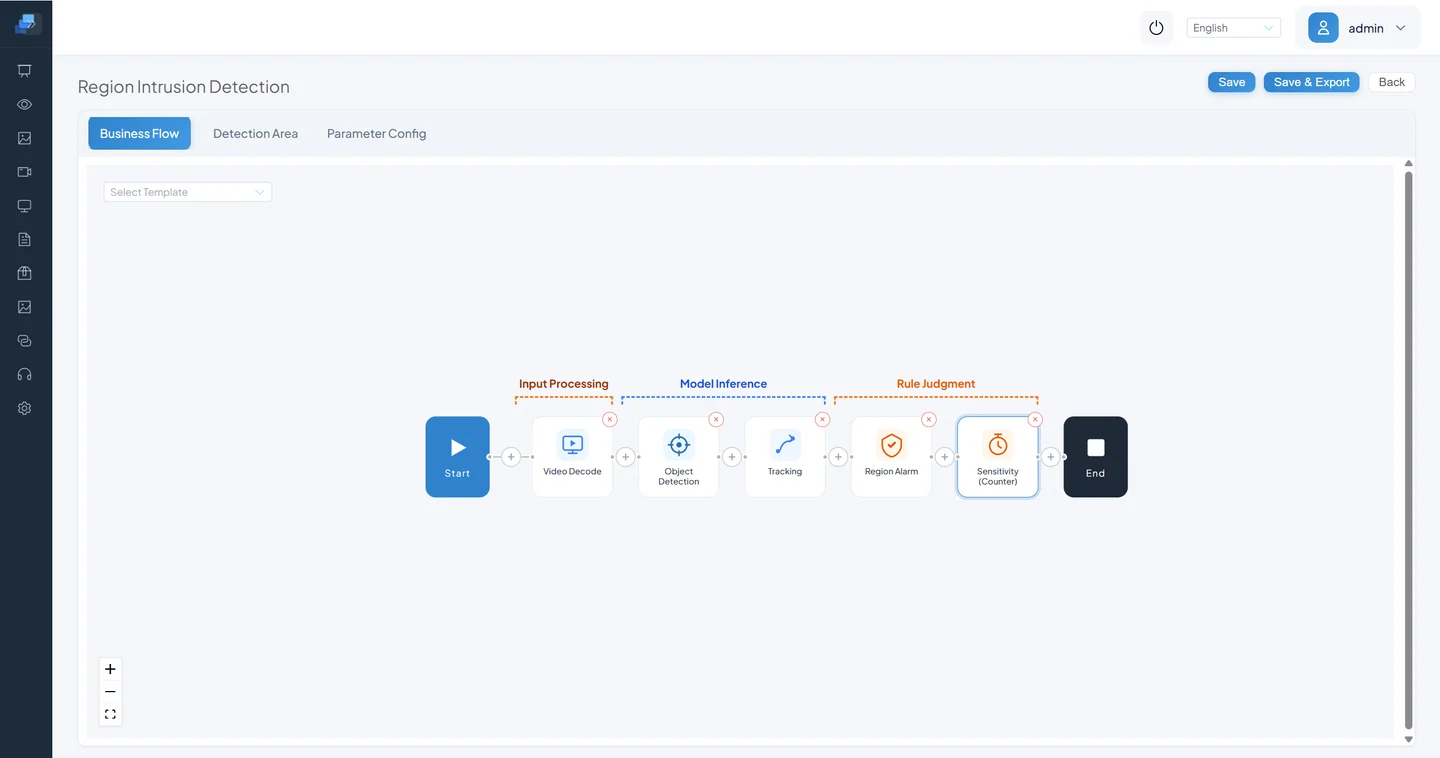
Business logic configuration:
Step 6: Add Event Reporting
Generated alarm events are reported to the system for statistical analysis and real-time push notifications.
Business logic configuration:
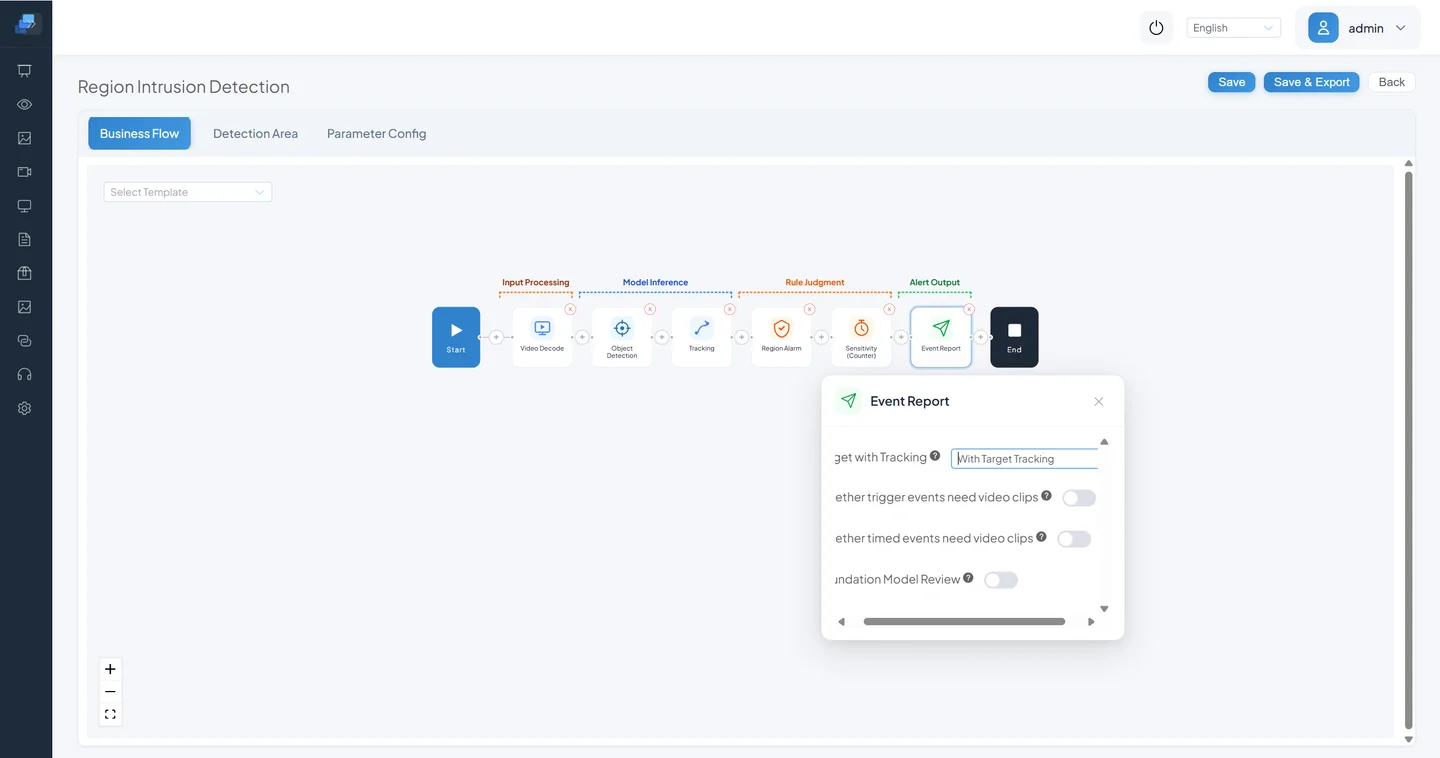
- Target tracking: With target tracking
- Video clip for trigger events: Enabled
- Video clip for scheduled events: Disabled
- Large model review: Disabled
The complete Zone Intrusion Detection pipeline is now configured. Next, we'll set the detailed control parameters for each node.
3.4 Configure Key Parameters
In the previous section, the pipeline was built using default parameter values. To achieve high accuracy and low false positive rates, fine-grained parameter tuning is essential.
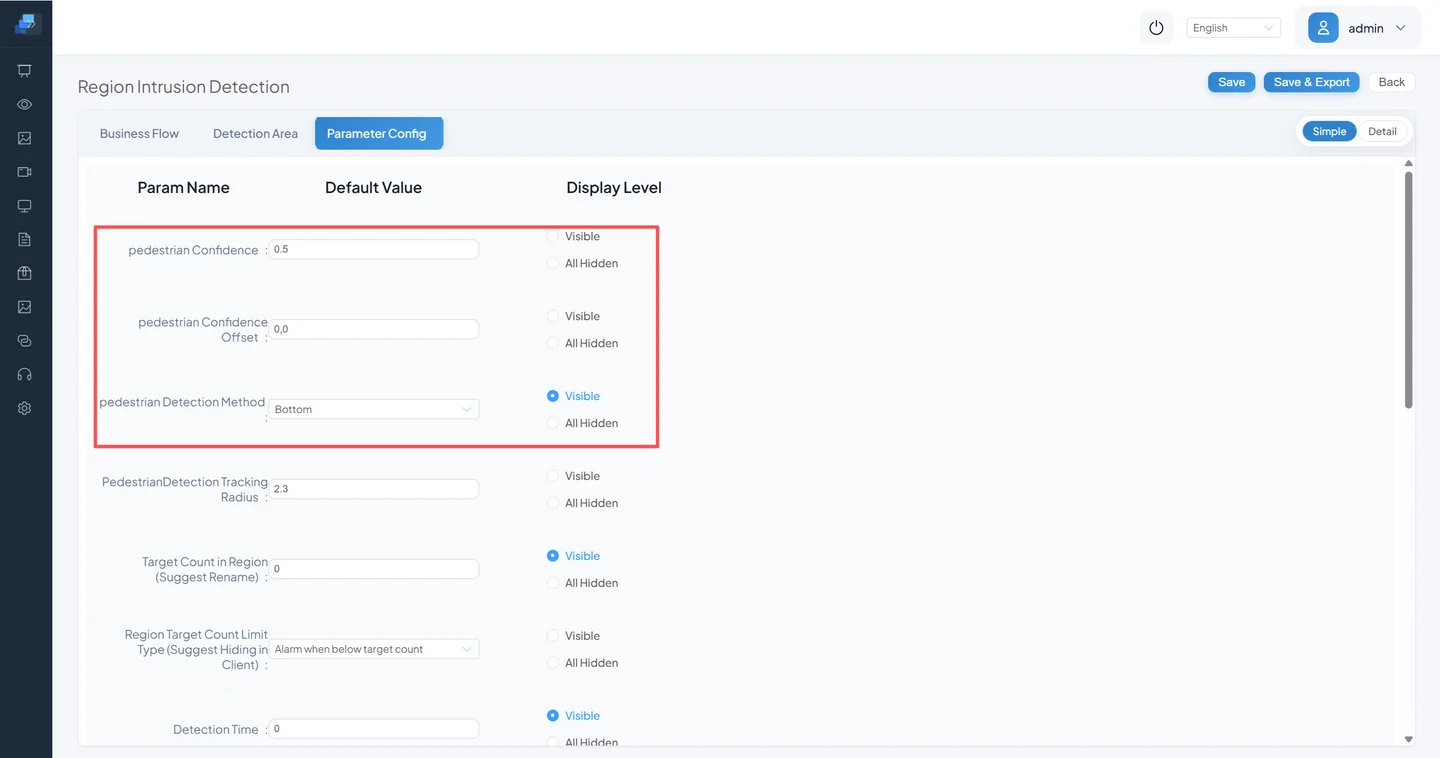
Click Parameter Configuration to switch to the parameters page.
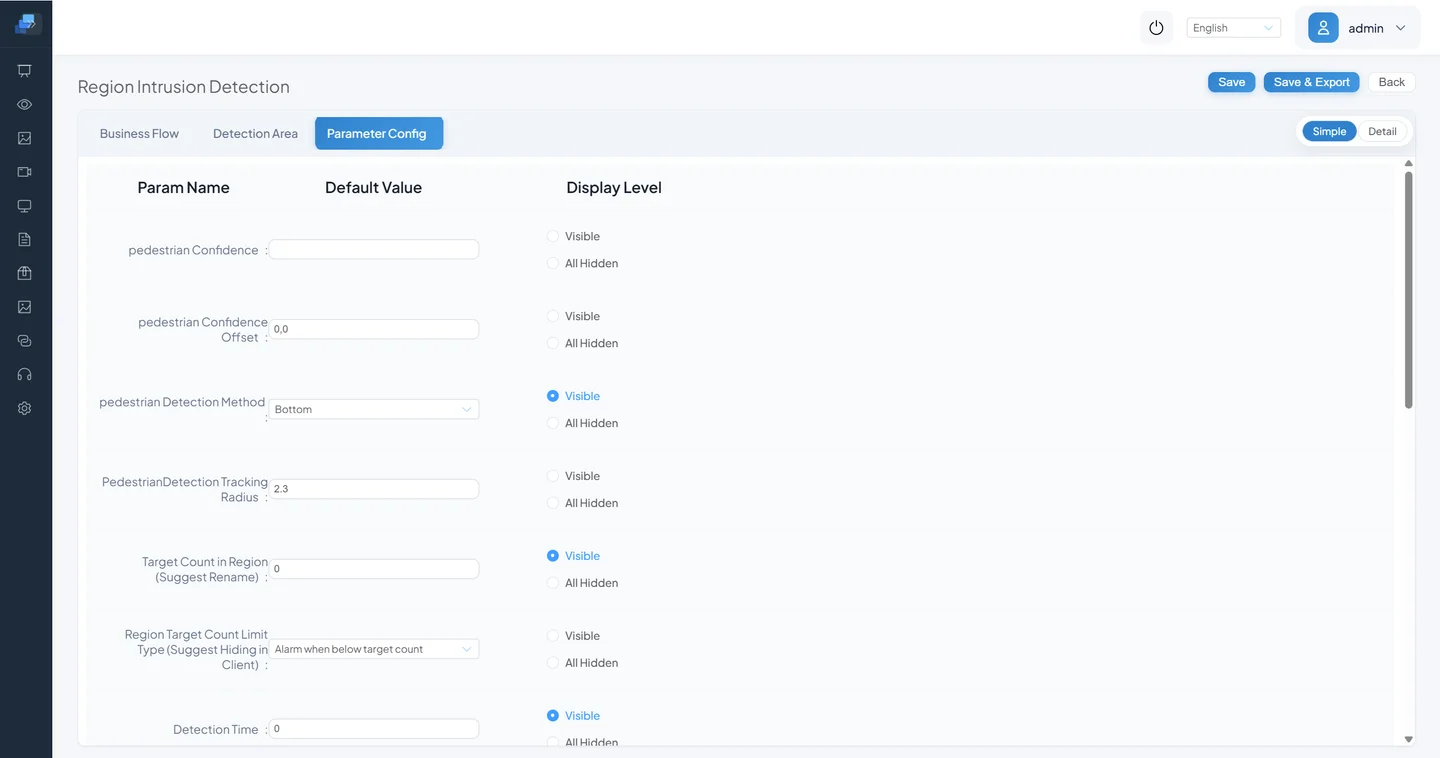
Object Detection Node
| Parameter | Recommended Value | Notes |
|---|---|---|
| Confidence Threshold | 0.5 | Adjustable up or down as needed |
| Confidence Offset | 0 | Adjusts confidence boundary |
| Detection Mode | Bottom | Defines which point of the bounding box determines zone entry. "Bottom" uses foot position — most appropriate for intrusion detection. Can also be set to center or top |
Tracking Algorithm
| Parameter | Recommended Value | Notes |
|---|---|---|
| Track History Frames | 10 | Track must persist for N frames before it's considered valid |
| Static Threshold | 80 | If tracking overlap exceeds 80%, the target is considered stationary |
| Track Radius | 2.3 | Track targets within 2.3m; beyond this, the target is considered lost |
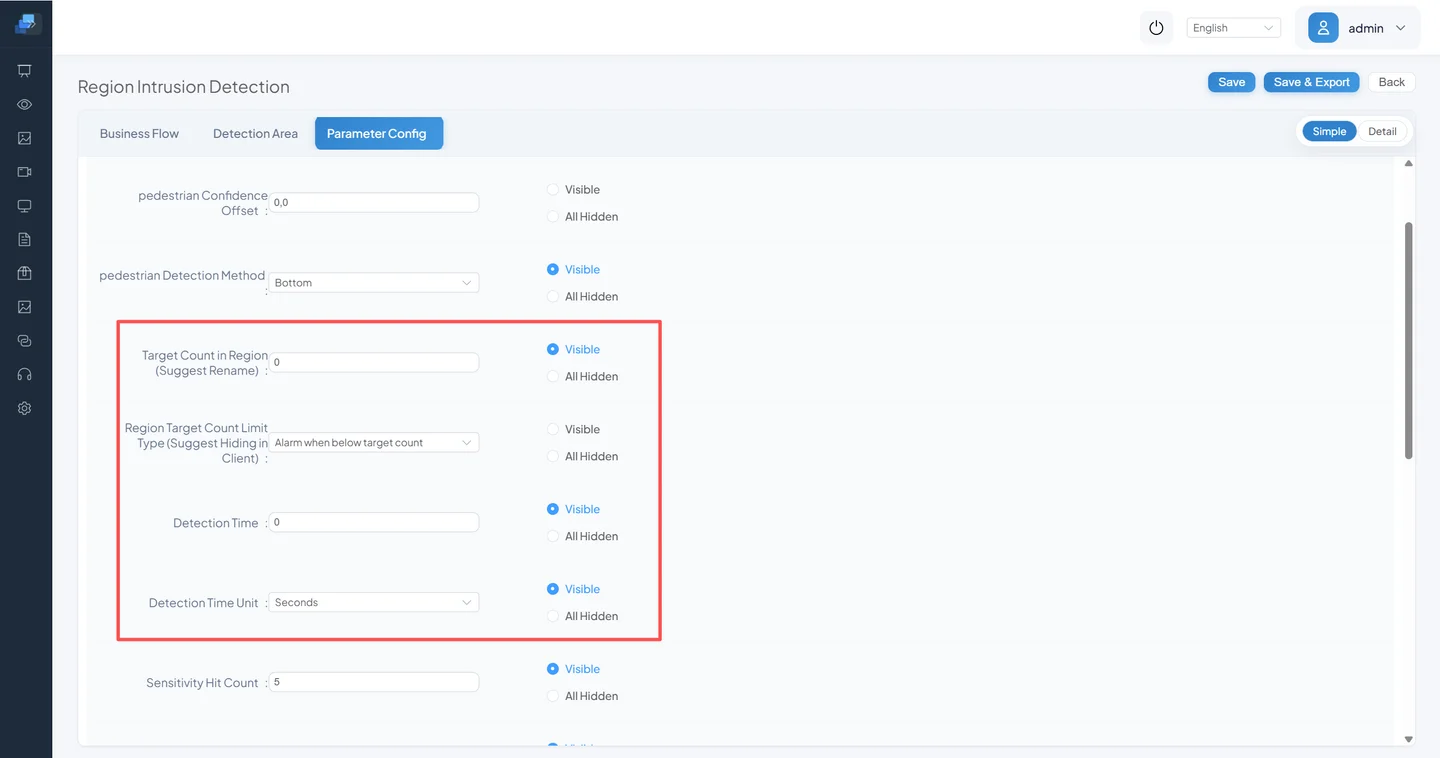
Region Alarm Judgment
| Parameter | Recommended Value | Notes |
|---|---|---|
| Target Count in Region | 0 | Triggers alarm when target count exceeds (or falls below) this number |
| Target Count Limit Type | Alarm when above target count | Alarm condition — used for target presence, gathering, etc. |
| Detection Time | ||
| Detection Time Unit |
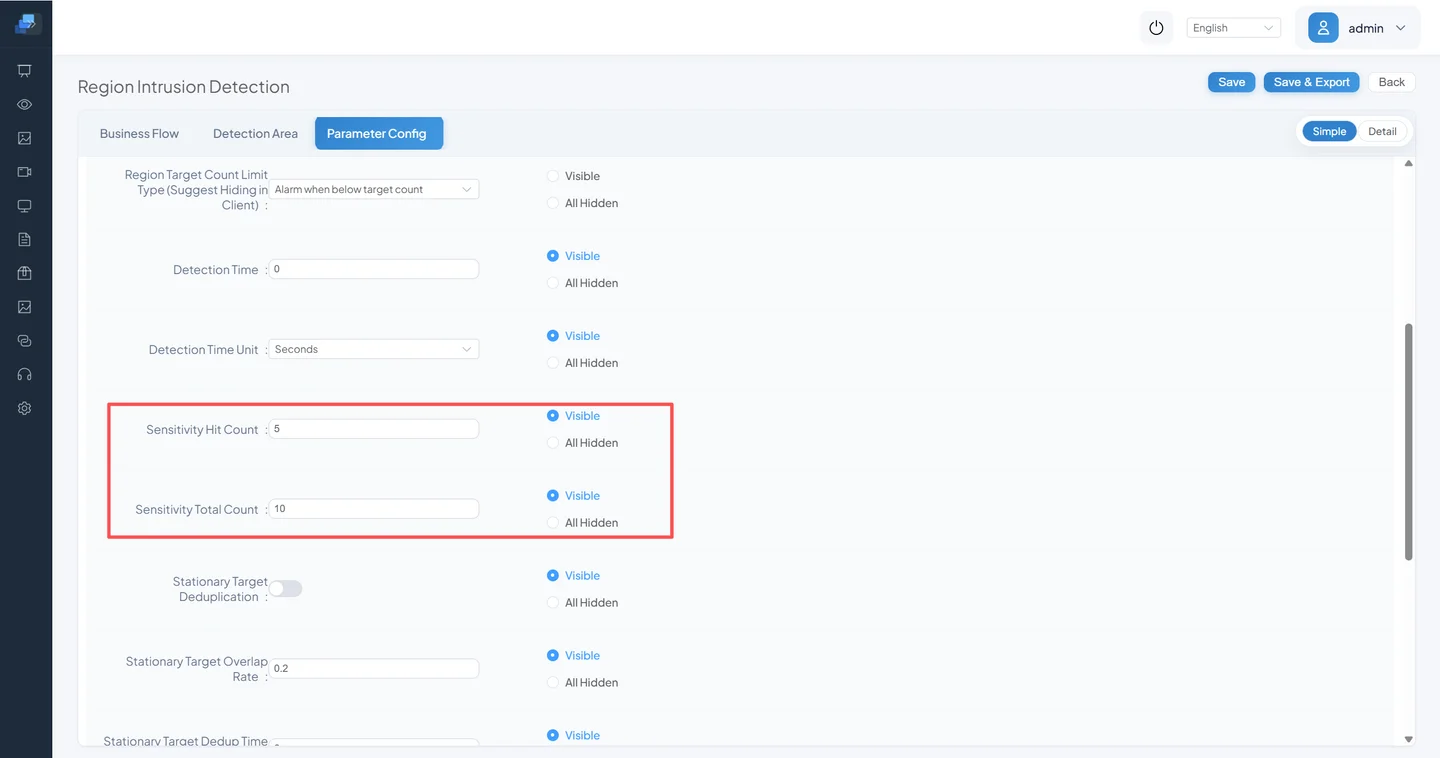
Sensitivity Calculation Node
| Parameter | Recommended Value | Notes |
|---|---|---|
| Sensitivity Hit Count | 3 | Triggers after 3 consecutive hits |
| Sensitivity Total Count | 10 | Evaluated within a 10-frame window |
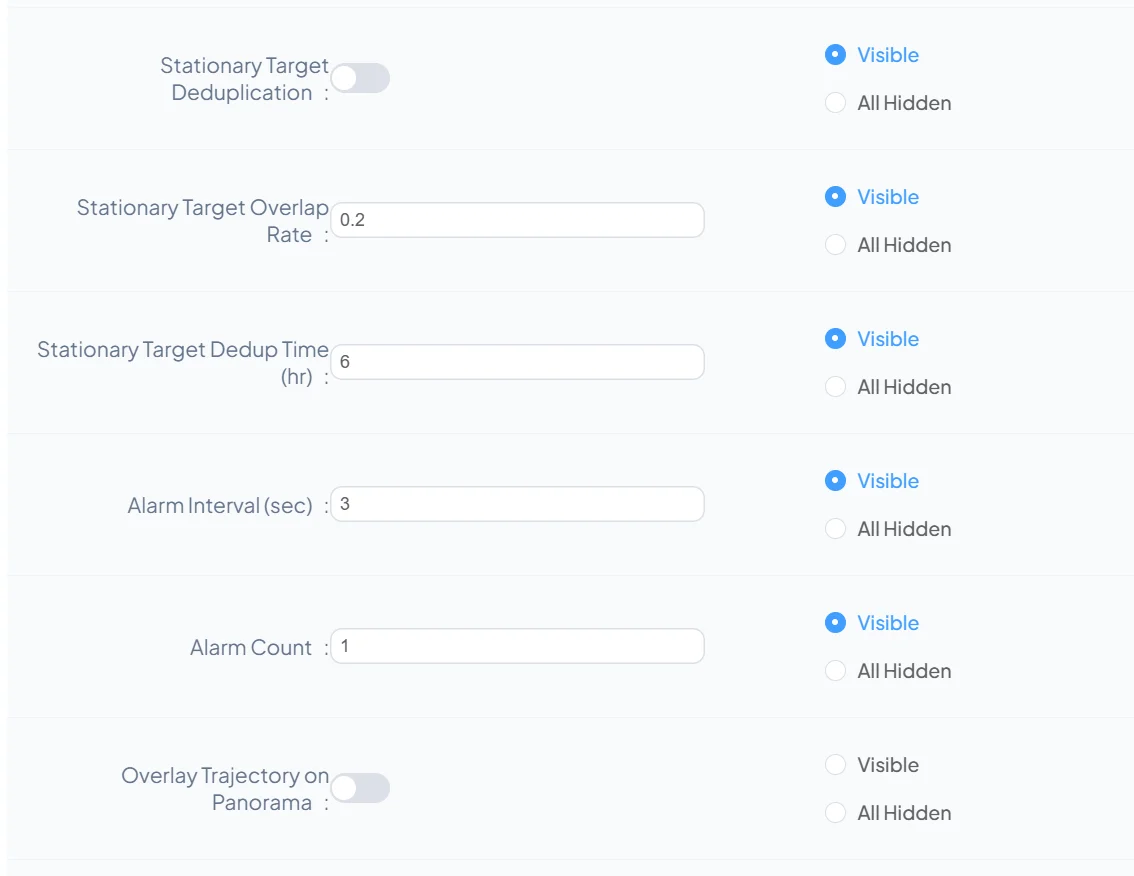
Event Reporting Node
| Parameter | Recommended Value | Notes |
|---|---|---|
| Alarm Interval | 3 | Minimum seconds between re-alarms for the same target |
| Alarm Count | 1 | Max repeated alarms per target — prevents excessive records |
| Static Object Dedup | Enabled | Stationary objects can trigger many repeated alarms — enabling dedup prevents this |
| Static Overlap Ratio | 0.2 | Overlap threshold for considering a target stationary |
| Static Dedup Duration | 6 | Maximum dedup window (hours) |
| Panoramic Trajectory Overlay | Disabled | Optional trajectory visualization |
3.5 Assign to a Video Channel and Test
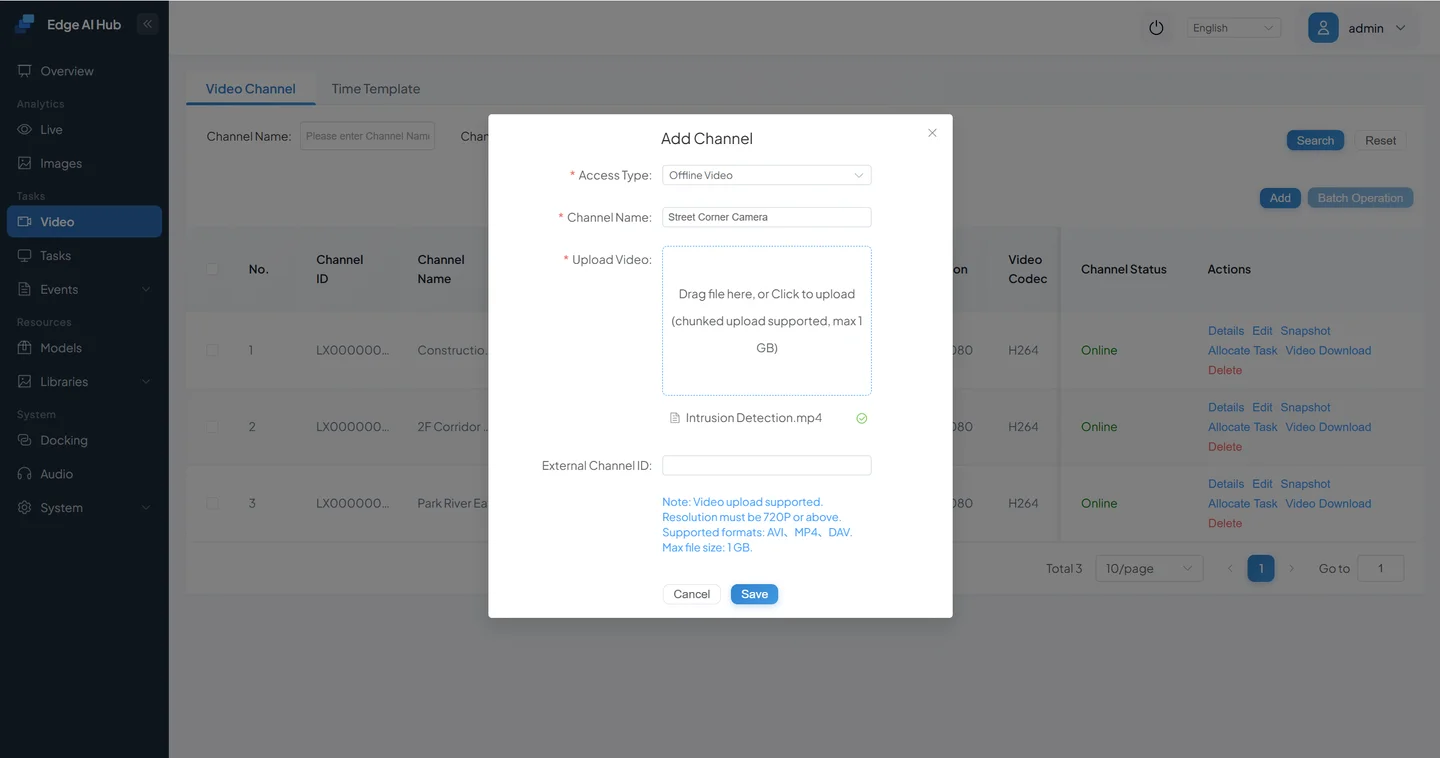
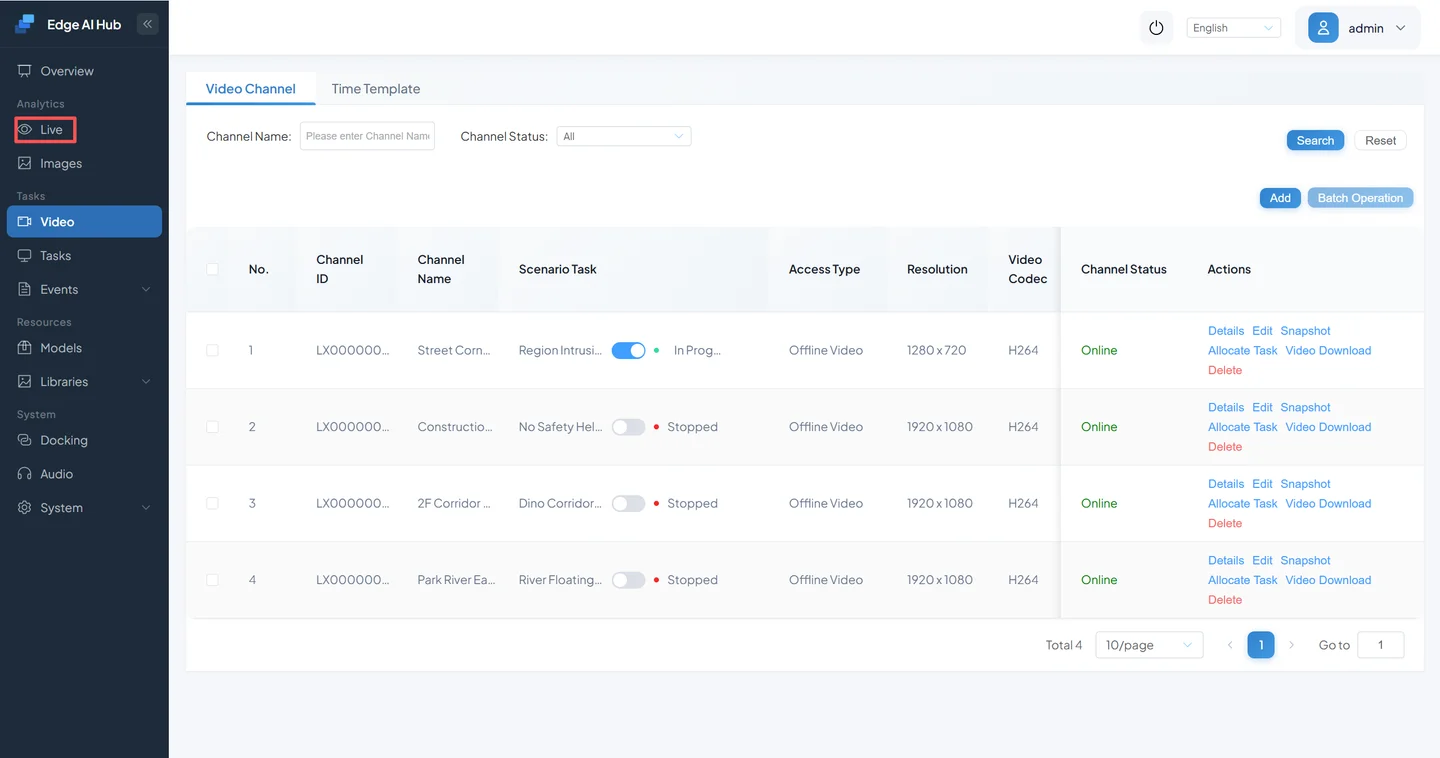
Create a video channel.
Click Video Sources to enter the channel page.
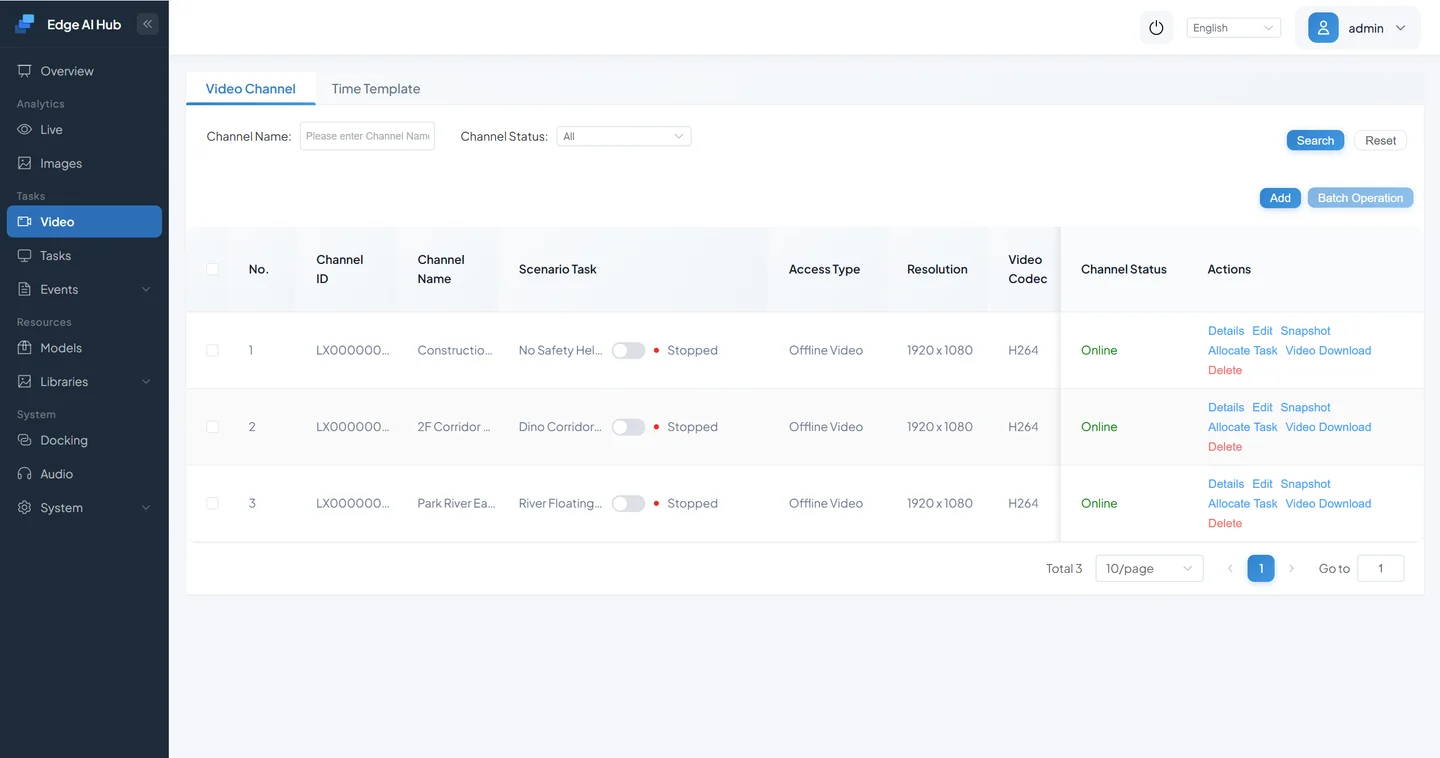
Create a new channel and upload a video.
- Open Service Assignment.
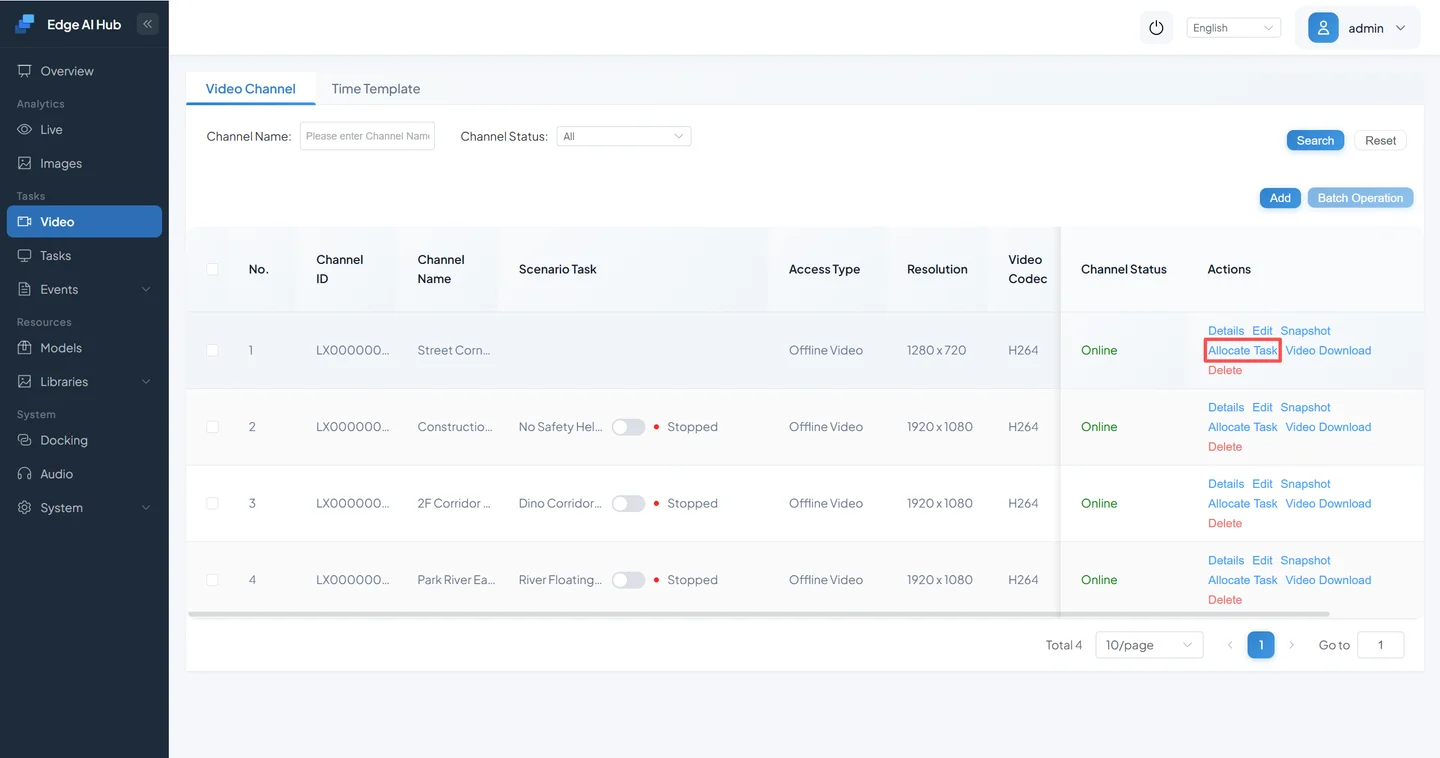
- Select the Zone Intrusion Detection task you just created.
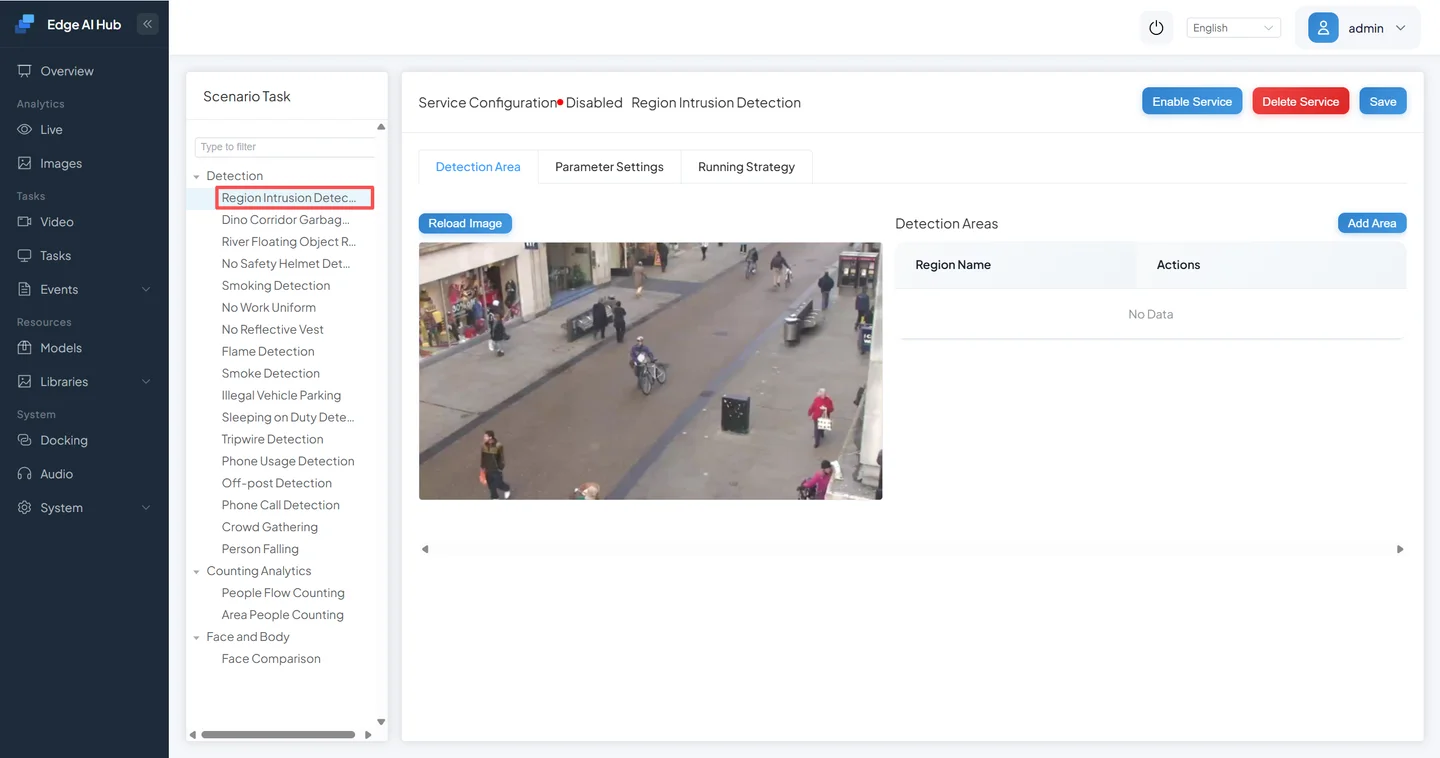
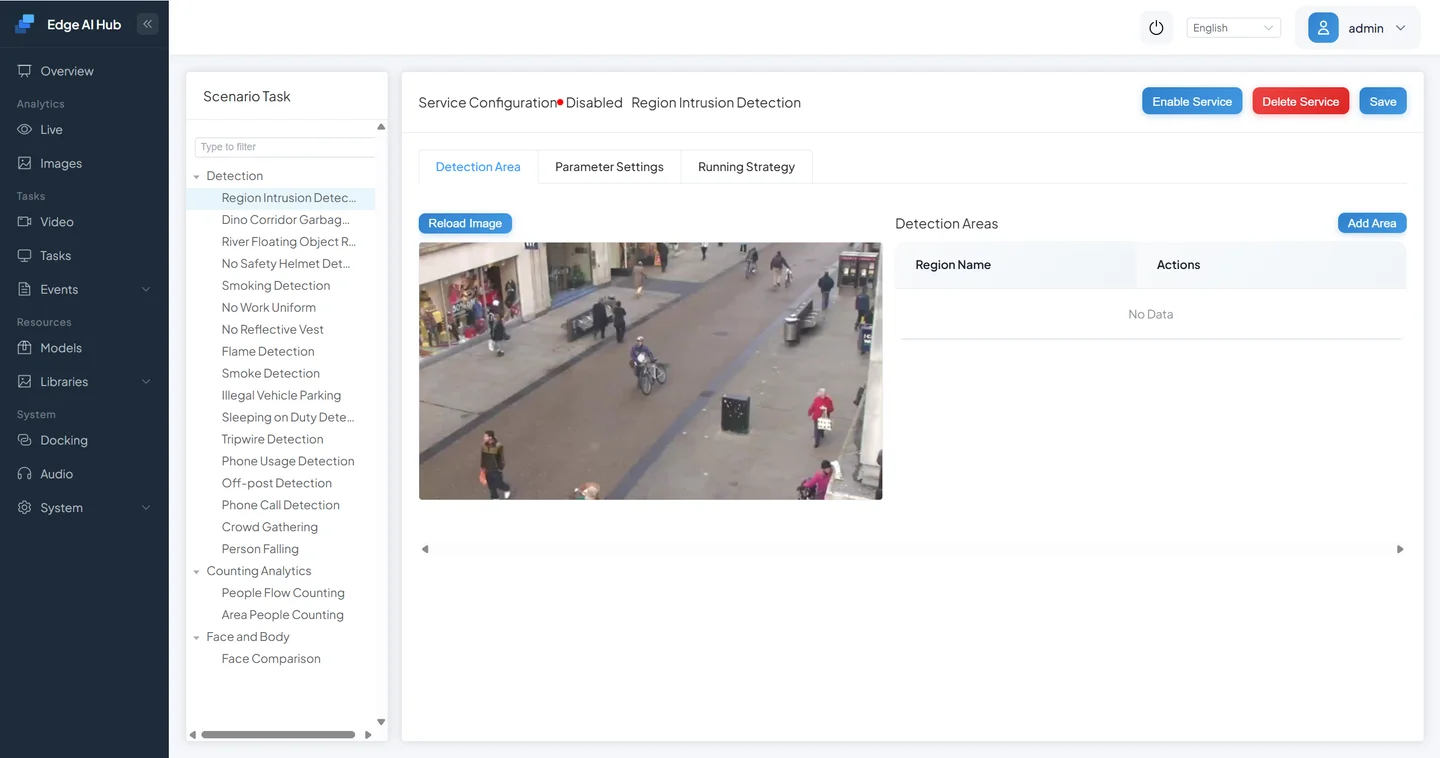
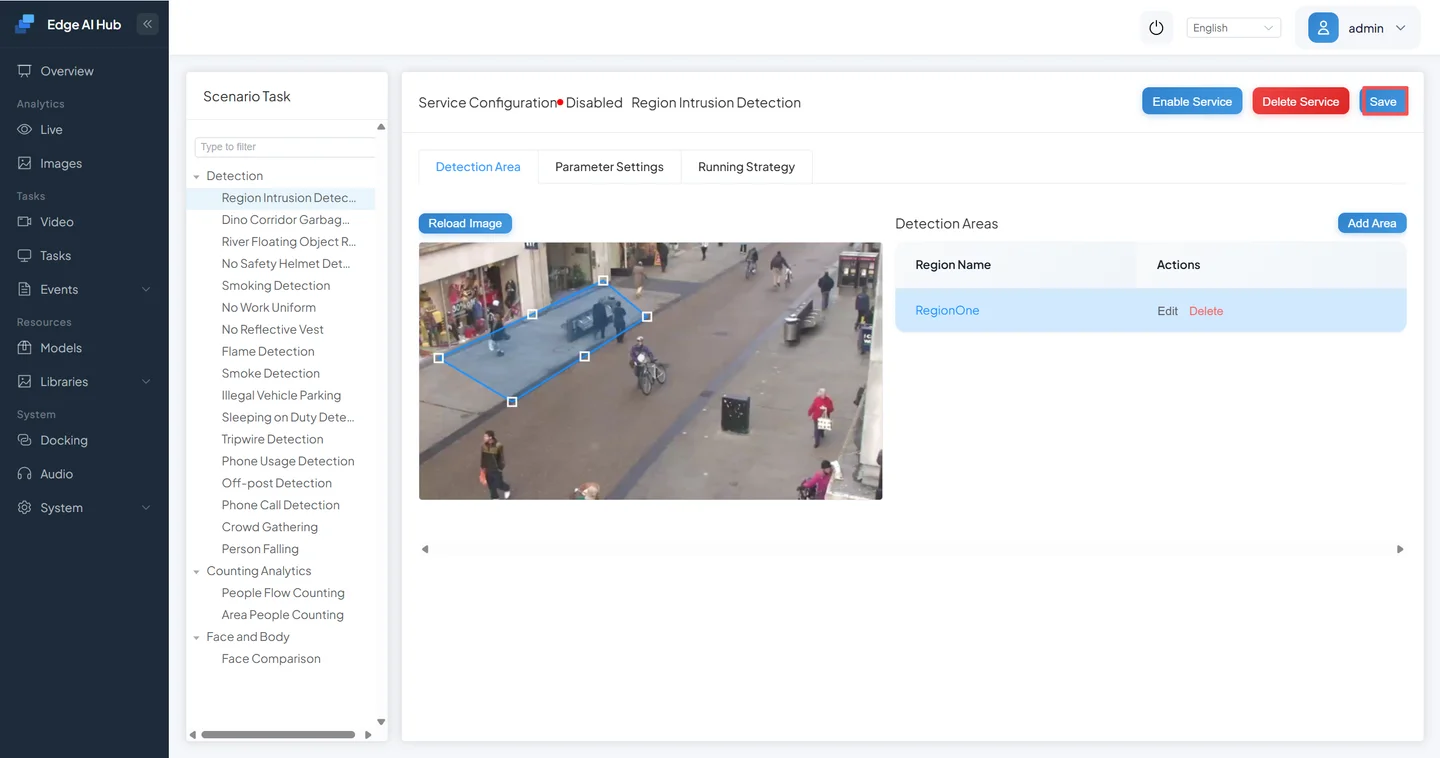
- Draw the detection region.
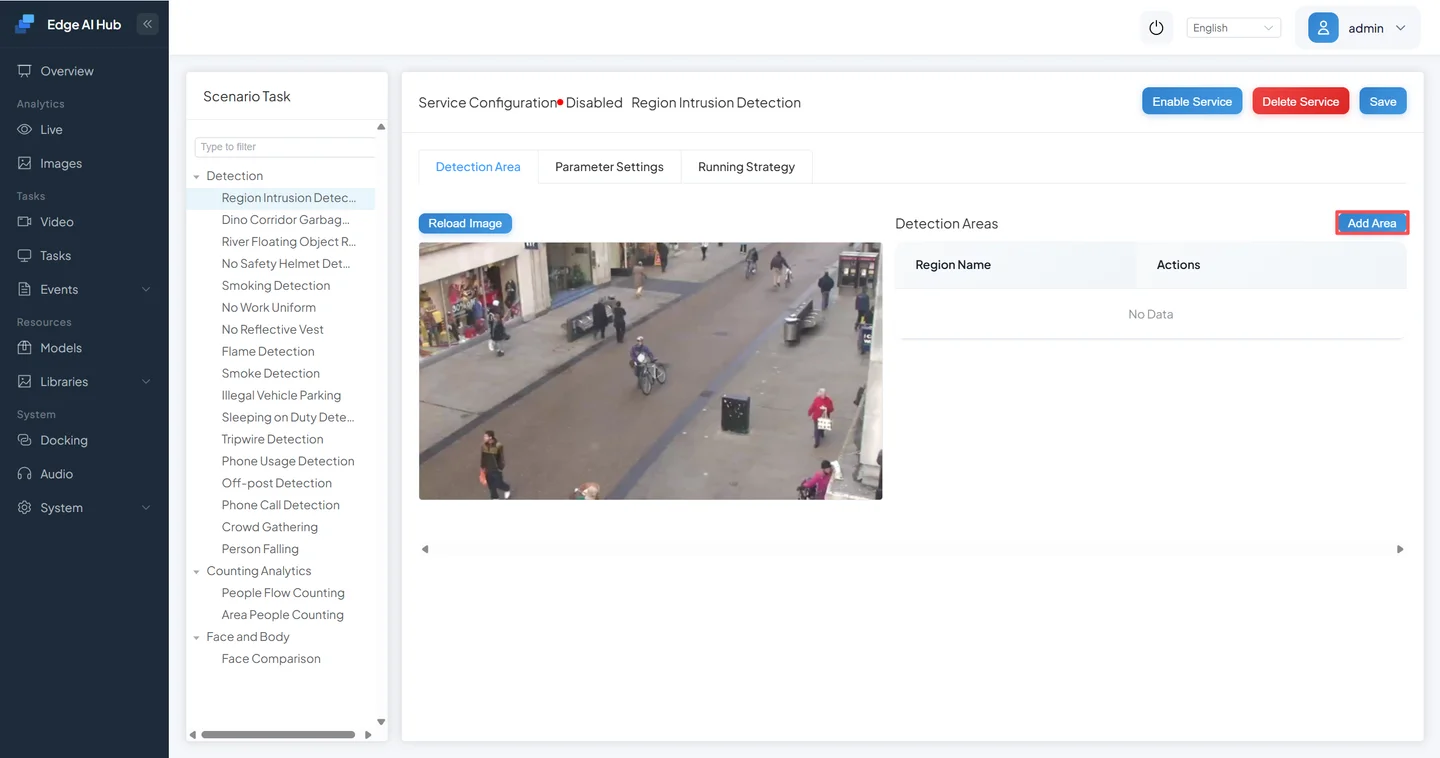
Click Add Region.
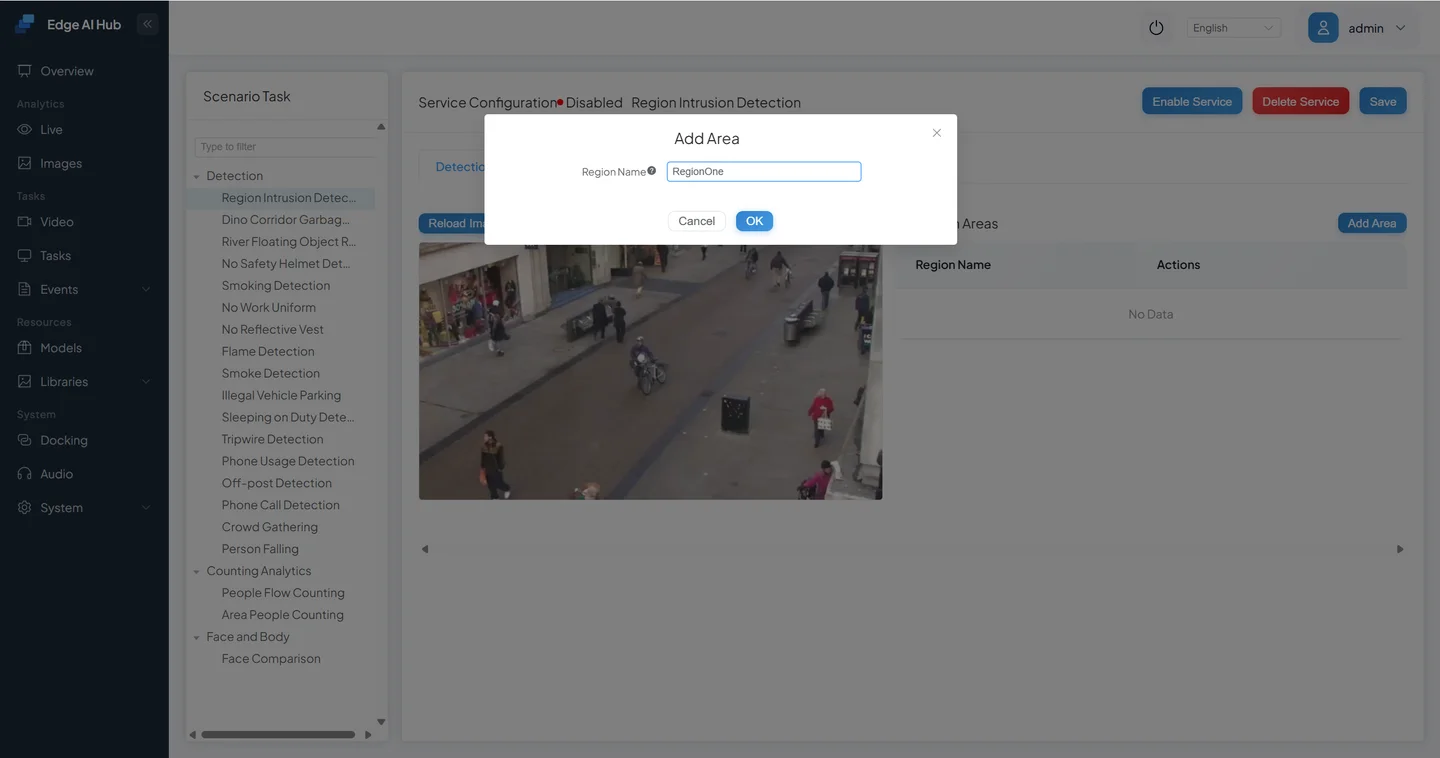
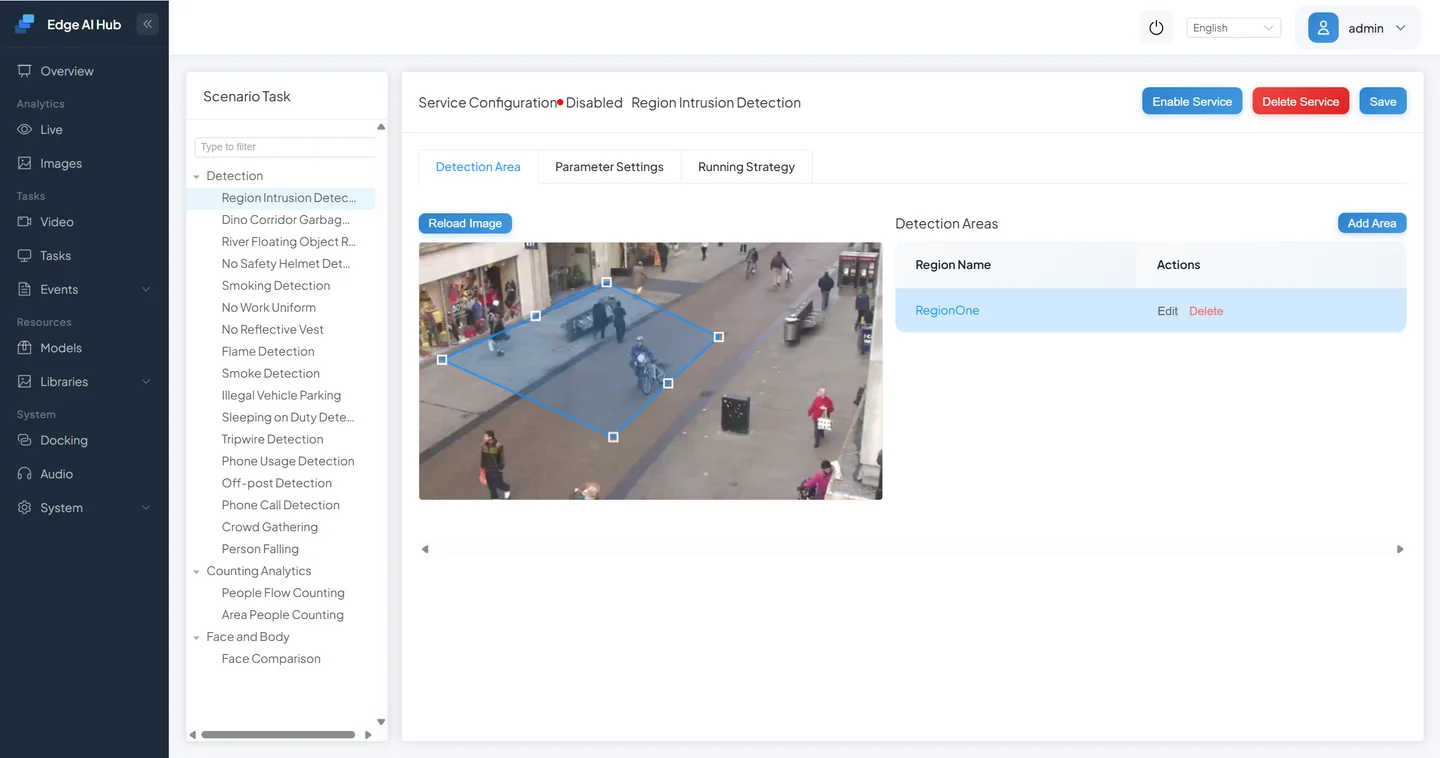
Adjust the region to the desired position.
- Configure the runtime strategy.
Set play count to 0 for looping playback.
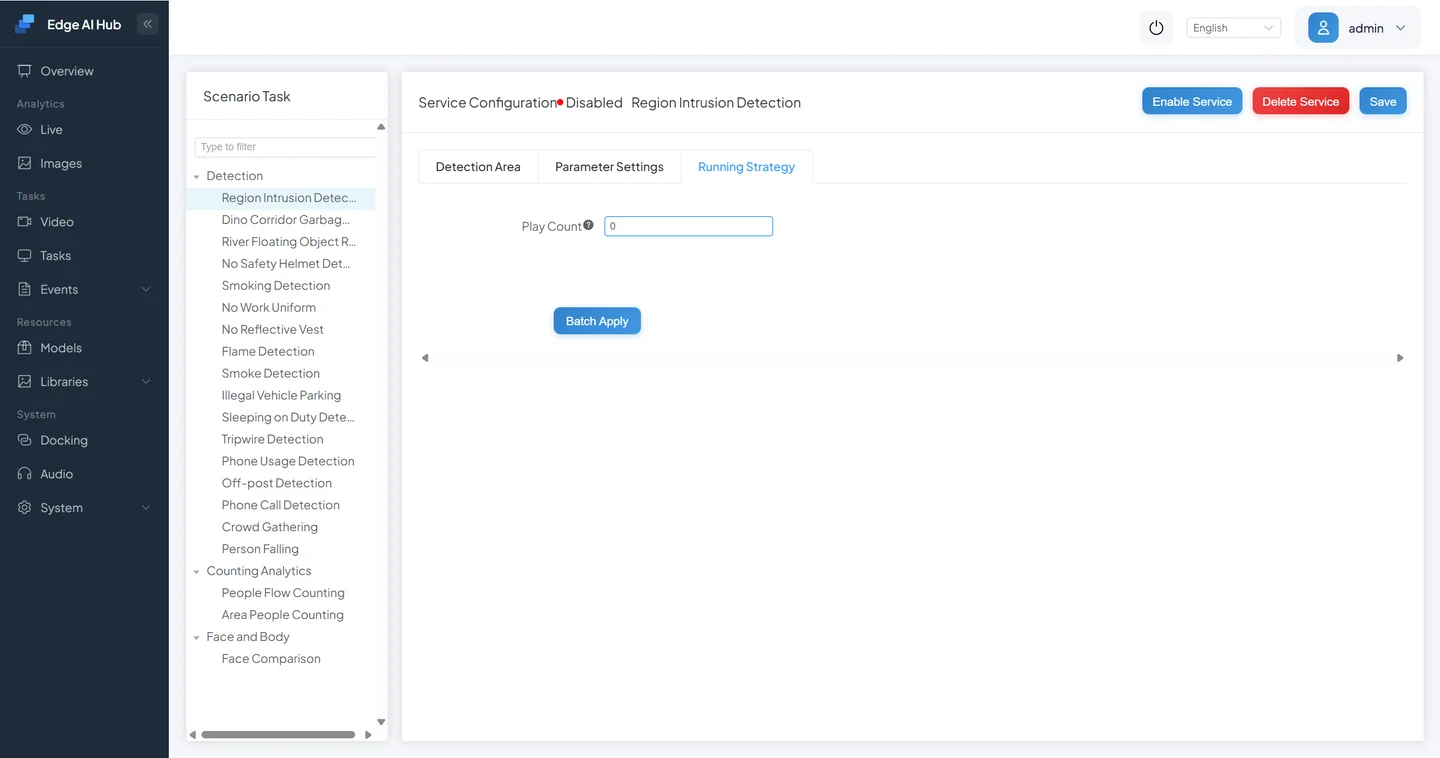
- Save and start the service.
3.6 Verify Results
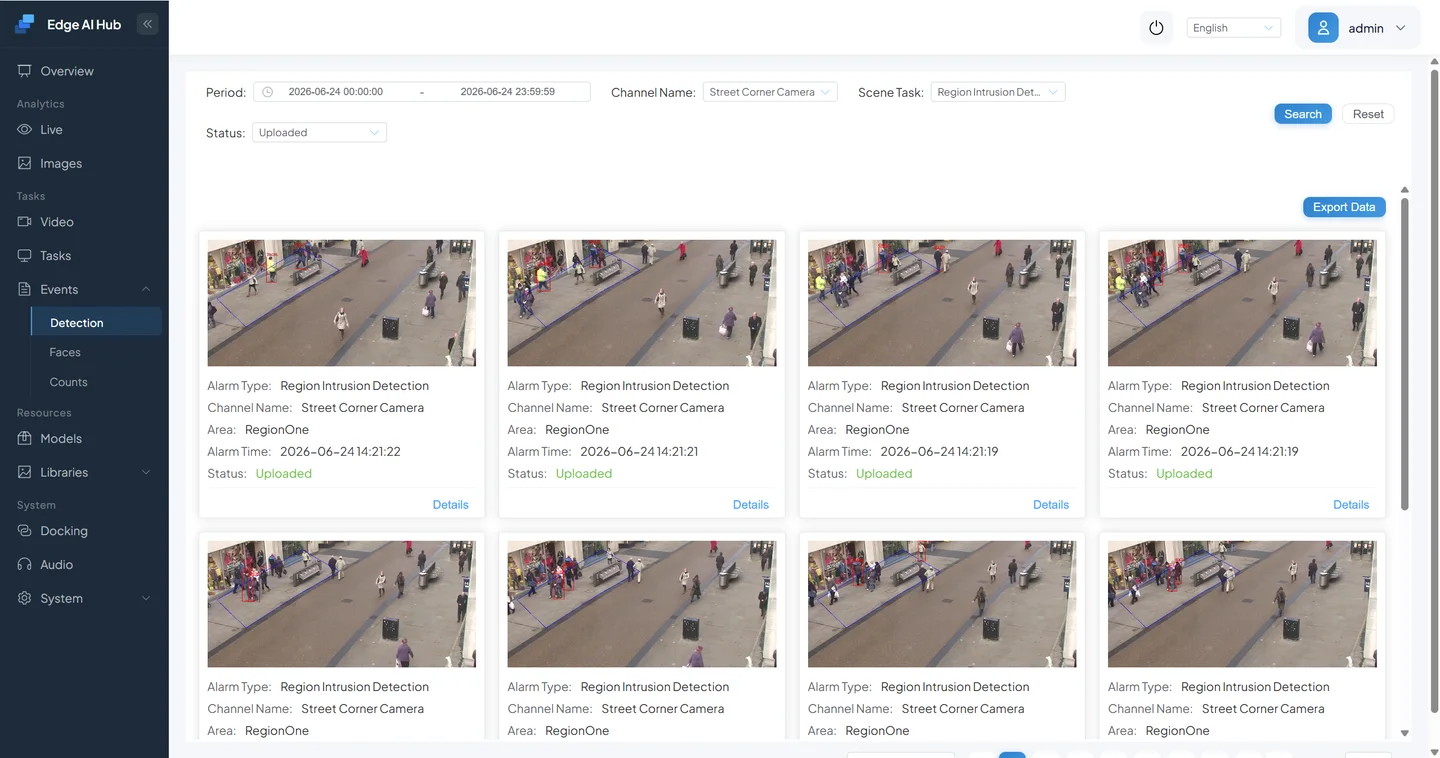
Go to Live Preview and Alarm Records to check the output.
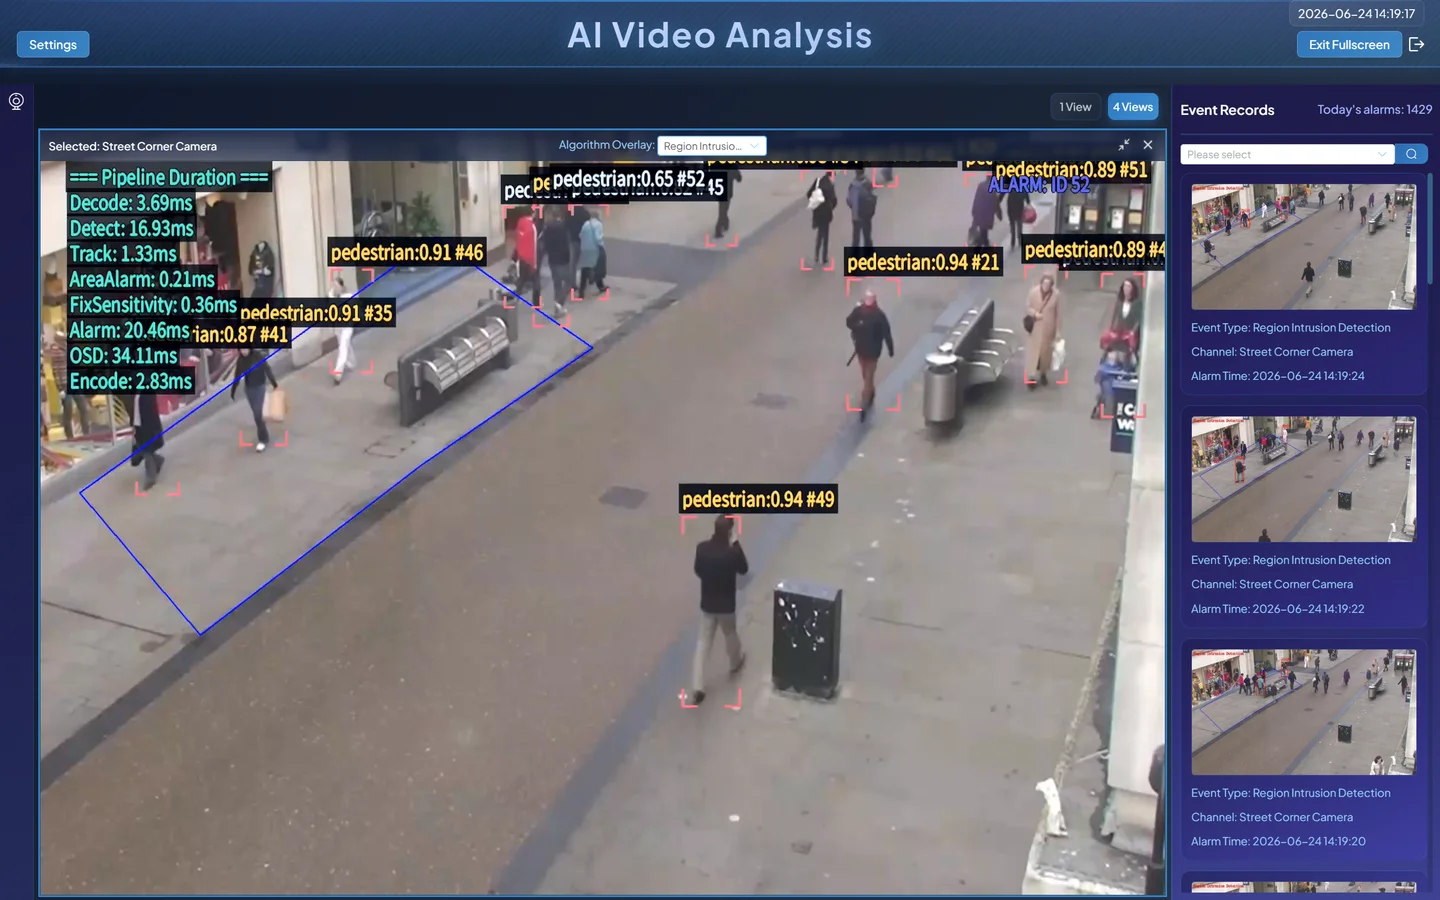
- Click Live Preview to enter the display page.
- Select the Street Corner Camera channel.
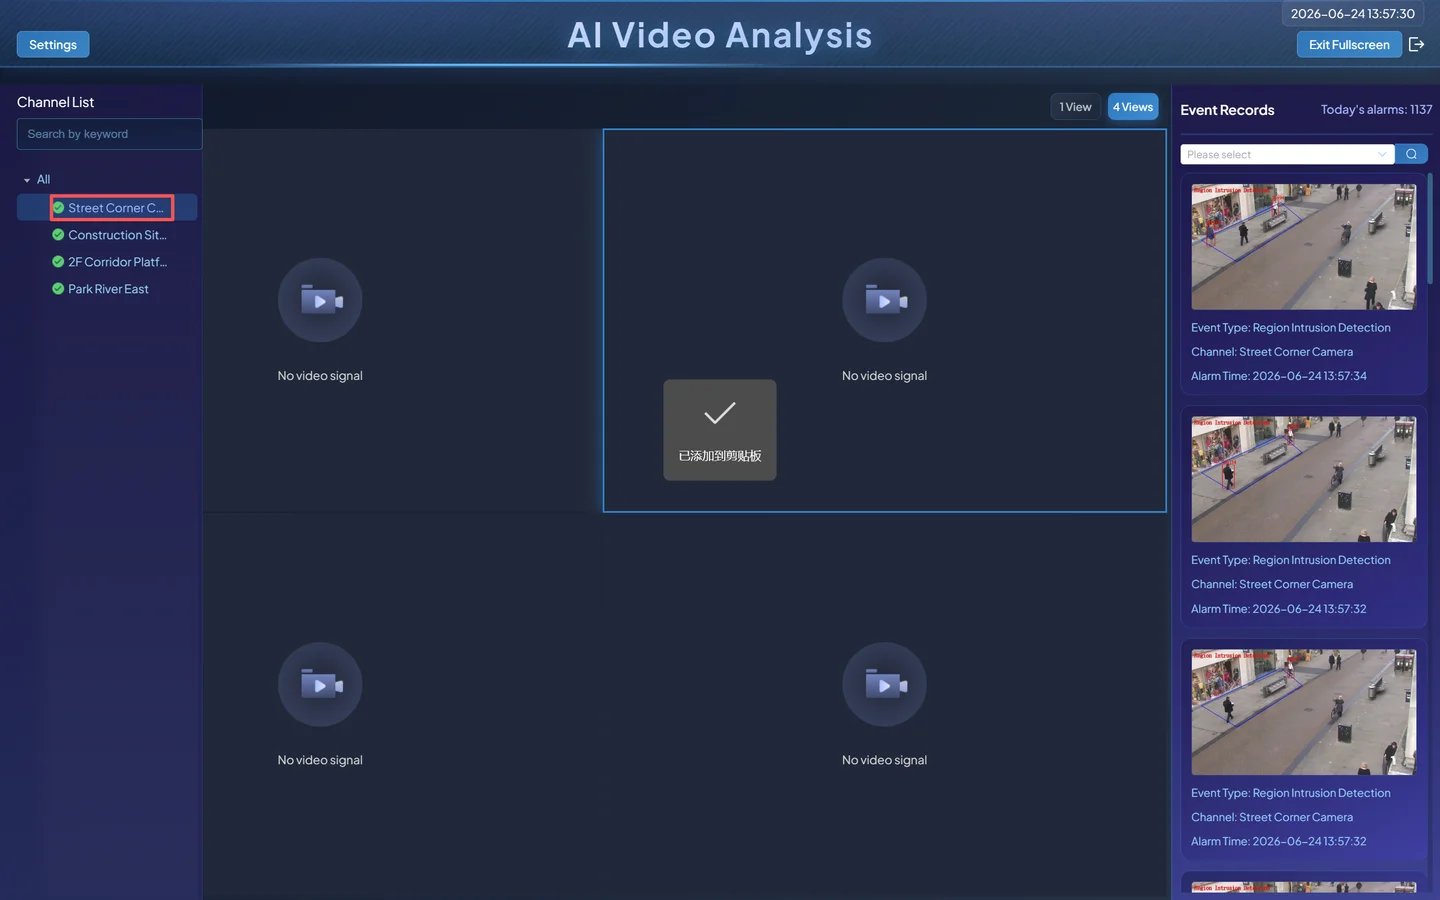
- Enable visualization overlay.
- Alarm notification popup.
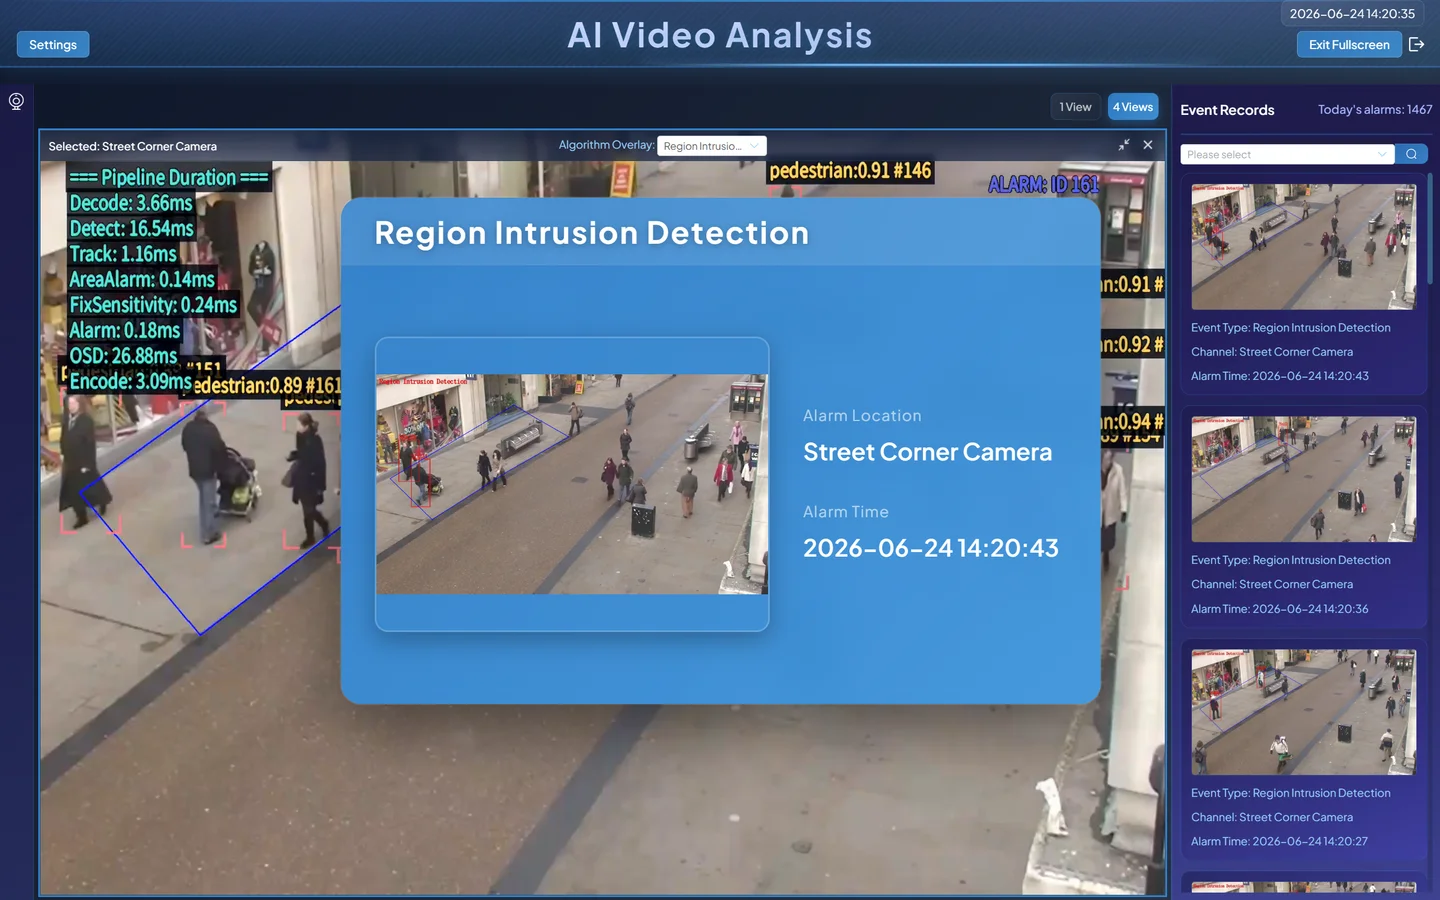
Results analysis:
- When a person enters the defined zone, bounding boxes and labels appear on the live feed.
- Alarms trigger only after consecutive hits — not on a single frame.
- Alarm records show the corresponding events.
- Alarm records.
You've now completed your first scenario task built from scratch.
Appendix
A. Node Quick Reference
WARNING
Coming soon.
B. Node Parameter Quick Reference
| Node Type | Common Parameters | Default / Recommended | Notes |
|---|---|---|---|
| Video Decode | Decode method | Hardware decode | Usually no changes needed |
| Object Detection | Model / confidence threshold | 0.5 | Results below threshold are dropped |
| Object Tracking | Max lost frames | 30 | How long before releasing an ID |
| Size Filter | Min width / min height | 0 | 0 means no filtering |
| Region Judgment | Judgment method | Bottom center point | Determines if target is in region |
| Sensitivity | Hit threshold / window size | 3 / 10 | Multi-frame accumulation before trigger |
| Event Reporting | Alarm type / alarm interval | 60 sec | Re-alarm interval for the same target |
C. Common Pipeline Troubleshooting
| Problem | Possible Cause | Solution |
|---|---|---|
| Service won't start after saving | Nodes not properly connected | Check that all nodes are linked end-to-end |
| No bounding boxes in live preview | Missing visualization overlay node | Add a visualization overlay at the end |
| Boxes visible but no alarms | Event reporting node missing or sensitivity threshold not met | Check the reporting node and threshold settings |
| Too many alarms | Missing sensitivity node or threshold too low | Raise the sensitivity threshold |
| Too many false positives | No size filter or detection region too broad | Tighten the filter and shrink the region |
D. Common Pipeline Templates
Detection-Only Pipeline
Video Decode → Object Detection → Object Tracking → Event Reporting → Video Visualization OverlayGood for: Pure object detection, foreign object detection, vehicle detection, etc.
Detection + Rule Pipeline
Video Decode → Object Detection → Object Tracking → Region/Line Judgment → Sensitivity → Event Reporting → Video Visualization OverlayGood for: Zone intrusion, perimeter detection, pedestrian flow counting, etc.
Detection + Classification Pipeline
Video Decode → Object Detection → Object Tracking → Category Filter → Object Classification → Sensitivity → Event Reporting → Video Visualization OverlayGood for: Hard hat, work uniform, smoking, phone usage detection, etc.
What's Next
If you've mastered this tutorial's content, the next step is:
- Volume 5: Model Porting
Which addresses another critical question: How to port third-party models to the device and integrate them into your own scenario tasks.